A literature review of the waist-to-hip ratio (WHR) shows that European women, on average, have more feminine-looking WHRs (lower) than non-European women, and among Europeans, Northern European women have more feminine-looking WHRs than other populations (Table 1). The WHR difference between European women and women from northeast Asia is generally small, but the studies cited below have a body fat confound whereby somewhat overweight European women have a more feminine WHR than northeast Asian women with normal weight. Thus, if European and Northeast Asian women are matched for percentage body fat, then the WHR difference between these groups will be greater. On the other hand, some populations -- such as South Asians, Native Americans and a number of sub-Saharan African populations -- have much higher WHRs (more masculine) than European women regardless of the body mass index (BMI) range or body fat range assessed. The case of sub-Saharan African women is of some interest in that these women have narrower pelves, thicker waists and more protruding buttocks compared to European women. Thus, compared to European women, the WHR in front view is higher and more masculine looking but lower and more feminine looking in side view in sub-Saharan African women. Therefore, the WHR of sub-Saharan women appears to not be readily classifiable as either more feminine or less feminine than that of European women, but given that the more protruding backside of sub-Saharan African women is an ethnic trait rather than something resulting from greater feminization [by sex hormones], the appropriate conclusion is that waist-hip proportions are less feminine among sub-Saharan African women. Notwithstanding their more protruding buttocks, a number of sub-Saharan African populations have higher WHRs than European women, but the opposite is true for some African populations -- such as the Khoi-San -- with extremely protruding buttocks (e.g. Fig 1c on the introduction page).
| Table 1. A summary of some studies that have addressed waist-to-hip ratios (WHR) in women. | ||||||||||||||||||||||||||||||||||||||||||||||||||||||||||||||||||||||||||||||||||||||||||
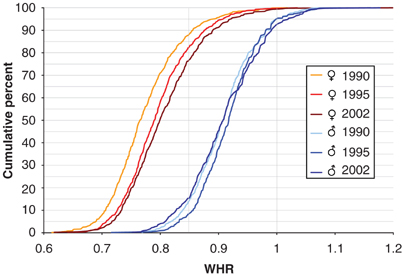
Fig 1a shows the distribution of WHR and waist circumference in a diverse Canadian sample of women aged 35-75 (see Table 1a for details).(1) Note the greater proportion of European women in the lower part of the WHR range (WHR < 0.75) and the higher portion of the WHR range (WHR > 0.85) compared to Chinese women, in spite of the European women being overweight, on average, and the Chinese normal, on average.
Somewhat related to Table 1a, in a sample of 192 Japanese women aged 45-54, the WHR was 0.83±0.08 and BMI was 23.5±3.1.(2) In a Swedish sample from Gothenburg, the WHR distributions of people aged 25-65 are shown below.(3) It appears that a greater proportion of Swedish women than Canadian European women had a WHR less than 0.8 if the data from Figure 1a and Table 1a are compared to the 2002 data in Figure 1b and Table 1b.
Fig 1b. Distribution of WHR in Gothenburg, Sweden.(3)
In a 2002 sample of ethnic minority women in Oslo, Norway, the ethnic differences in WHR, waist circumference and BMI are shown below, and these differences generally did not change after adjusting for education, physical activity and smoking.(4) Note the high WHRs of South Asians.
Fig 1c. WHR as a function of BMI in ethnic groups residing in Oslo, Norway.(4)
Fig 1e. BMI as a function of age in ethnic groups residing in Oslo, Norway.(4)
|
||||||||||||||||||||||||||||||||||||||||||||||||||||||||||||||||||||||||||||||||||||||||||
The following chart summarizes a number of studies that have compared the WHR of whites and people from India.(5)
|
||||||||||||||||||||||||||||||||||||||||||||||||||||||||||||||||||||||||||||||||||||||||||
| The following data are from the women sampled in the second Monica Survey (1987-1992).(6) | ||||||||||||||||||||||||||||||||||||||||||||||||||||||||||||||||||||||||||||||||||||||||||
| Country | Age | WHR | Year* | Number | ||||||||||||||||||||||||||||||||||||||||||||||||||||||||||||||||||||||||||||||||||||||
| Australia - Perth | 25-34 | 0.74 | 822 | |||||||||||||||||||||||||||||||||||||||||||||||||||||||||||||||||||||||||||||||||||||||
| Sweden -Gothenburg | 25-34 | 0.76 | 722 | |||||||||||||||||||||||||||||||||||||||||||||||||||||||||||||||||||||||||||||||||||||||
| Finland - Kuopio Province | 25-34 | 0.76 | 803 | |||||||||||||||||||||||||||||||||||||||||||||||||||||||||||||||||||||||||||||||||||||||
| Finland - North Karelia | 25-34 | 0.76 | 1563 | |||||||||||||||||||||||||||||||||||||||||||||||||||||||||||||||||||||||||||||||||||||||
| Finland - Turku/Loimaa | 25-34 | 0.76 | 778 | |||||||||||||||||||||||||||||||||||||||||||||||||||||||||||||||||||||||||||||||||||||||
| Germany - Augsburg urban | 25-34 | 0.76 | 861 | |||||||||||||||||||||||||||||||||||||||||||||||||||||||||||||||||||||||||||||||||||||||
| Italy -Friuli | 25-34 | 0.77 | 894 | |||||||||||||||||||||||||||||||||||||||||||||||||||||||||||||||||||||||||||||||||||||||
| China - Beijing | 25-34 | 0.77 | 859 | |||||||||||||||||||||||||||||||||||||||||||||||||||||||||||||||||||||||||||||||||||||||
| Germany - Augsburg rural | 25-34 | 0.77 | 1082 | |||||||||||||||||||||||||||||||||||||||||||||||||||||||||||||||||||||||||||||||||||||||
| U.K. - Glasgow | 25-34 | 0.77 | 781 | |||||||||||||||||||||||||||||||||||||||||||||||||||||||||||||||||||||||||||||||||||||||
| Italy - Area Brianza | 25-34 | 0.78 | 753 | |||||||||||||||||||||||||||||||||||||||||||||||||||||||||||||||||||||||||||||||||||||||
| Spain - Catalonia | 25-34 | 0.78 | 1191 | |||||||||||||||||||||||||||||||||||||||||||||||||||||||||||||||||||||||||||||||||||||||
| Australia - Newcastle | 25-34 | 0.79 | 757 | |||||||||||||||||||||||||||||||||||||||||||||||||||||||||||||||||||||||||||||||||||||||
| Yugoslavia - Novi Sad | 25-34 | 0.79 | 791 | |||||||||||||||||||||||||||||||||||||||||||||||||||||||||||||||||||||||||||||||||||||||
| Germany - Halle County | 25-34 | 0.80 | 480 | |||||||||||||||||||||||||||||||||||||||||||||||||||||||||||||||||||||||||||||||||||||||
| Sweden - Northern Sweden | 25-34 | 0.80 | 791 | |||||||||||||||||||||||||||||||||||||||||||||||||||||||||||||||||||||||||||||||||||||||
| Czech Republic - Czech Republic | 25-34 | 0.81 | 1410 | |||||||||||||||||||||||||||||||||||||||||||||||||||||||||||||||||||||||||||||||||||||||
| Denmark - Glostrup | 25-34 | 0.82 | 735 | |||||||||||||||||||||||||||||||||||||||||||||||||||||||||||||||||||||||||||||||||||||||
| 10th percentile WHR | ||||||||||||||||||||||||||||||||||||||||||||||||||||||||||||||||||||||||||||||||||||||||||
| Australia - Perth | 35-64 | 0.69 | 640 | |||||||||||||||||||||||||||||||||||||||||||||||||||||||||||||||||||||||||||||||||||||||
| Sweden -Gothenburg | 35-64 | 0.71 | 622 | |||||||||||||||||||||||||||||||||||||||||||||||||||||||||||||||||||||||||||||||||||||||
| Finland - Kuopio Province | 35-64 | 0.71 | 626 | |||||||||||||||||||||||||||||||||||||||||||||||||||||||||||||||||||||||||||||||||||||||
| Finland - Turku/Loimaa | 35-64 | 0.71 | 589 | |||||||||||||||||||||||||||||||||||||||||||||||||||||||||||||||||||||||||||||||||||||||
| Finland - North Karelia | 35-64 | 0.72 | 1199 | |||||||||||||||||||||||||||||||||||||||||||||||||||||||||||||||||||||||||||||||||||||||
| Australia - Newcastle | 35-64 | 0.72 | 673 | |||||||||||||||||||||||||||||||||||||||||||||||||||||||||||||||||||||||||||||||||||||||
| U.K. - Glasgow | 35-64 | 0.73 | 634 | |||||||||||||||||||||||||||||||||||||||||||||||||||||||||||||||||||||||||||||||||||||||
| Germany - Augsburg urban | 35-64 | 0.73 | 685 | |||||||||||||||||||||||||||||||||||||||||||||||||||||||||||||||||||||||||||||||||||||||
| Italy -Friuli | 35-64 | 0.73 | 698 | |||||||||||||||||||||||||||||||||||||||||||||||||||||||||||||||||||||||||||||||||||||||
| Italy - Area Brianza | 35-64 | 0.73 | 606 | |||||||||||||||||||||||||||||||||||||||||||||||||||||||||||||||||||||||||||||||||||||||
| Germany - Augsburg rural | 35-64 | 0.74 | 831 | |||||||||||||||||||||||||||||||||||||||||||||||||||||||||||||||||||||||||||||||||||||||
| China - Beijing | 35-64 | 0.74 | 680 | |||||||||||||||||||||||||||||||||||||||||||||||||||||||||||||||||||||||||||||||||||||||
| Yugoslavia - Novi Sad | 35-64 | 0.75 | 598 | |||||||||||||||||||||||||||||||||||||||||||||||||||||||||||||||||||||||||||||||||||||||
| Germany - Halle County | 35-64 | 0.75 | 365 | |||||||||||||||||||||||||||||||||||||||||||||||||||||||||||||||||||||||||||||||||||||||
| Sweden - Northern Sweden | 35-64 | 0.75 | 610 | |||||||||||||||||||||||||||||||||||||||||||||||||||||||||||||||||||||||||||||||||||||||
| Czech Republic - Czech Republic | 35-64 | 0.75 | 1068 | |||||||||||||||||||||||||||||||||||||||||||||||||||||||||||||||||||||||||||||||||||||||
| Spain - Catalonia | 35-64 | 0.76 | 779 | |||||||||||||||||||||||||||||||||||||||||||||||||||||||||||||||||||||||||||||||||||||||
| Denmark - Glostrup | 35-64 | 0.76 | 565 | |||||||||||||||||||||||||||||||||||||||||||||||||||||||||||||||||||||||||||||||||||||||
| *Second MONICA Survey (1987-1992); MONICA = Monitoring trends and determinants in cardiovascular disease.(6) | ||||||||||||||||||||||||||||||||||||||||||||||||||||||||||||||||||||||||||||||||||||||||||
| The following data are from miscellaneous studies. | ||||||||||||||||||||||||||||||||||||||||||||||||||||||||||||||||||||||||||||||||||||||||||
| Women | Age | WHR | Year* | Number | ||||||||||||||||||||||||||||||||||||||||||||||||||||||||||||||||||||||||||||||||||||||
| American white(7) | 23 (18-30) | 0.72±0.04 | 1999 (p) | 92 | ||||||||||||||||||||||||||||||||||||||||||||||||||||||||||||||||||||||||||||||||||||||
| American white(8) | 19.6±1.1 (18-23) | 0.73±0.04 | 2004 (p) | 68 | ||||||||||||||||||||||||||||||||||||||||||||||||||||||||||||||||||||||||||||||||||||||
| Poland(9) | 29.9±3.54 (24-37) | 0.73±0.049 | 2004 (p) | 119 | ||||||||||||||||||||||||||||||||||||||||||||||||||||||||||||||||||||||||||||||||||||||
| China - Changsha(10) | 20-24 | 0.74±0.04 | 2006 (p) | 368 | ||||||||||||||||||||||||||||||||||||||||||||||||||||||||||||||||||||||||||||||||||||||
| Scotland (representative)(11) | 16-24 | 0.76 | 1998 | 389 | ||||||||||||||||||||||||||||||||||||||||||||||||||||||||||||||||||||||||||||||||||||||
| Greece(12) | 20-44 | 0.77±0.07 | 2005 (p) | 3405 | ||||||||||||||||||||||||||||||||||||||||||||||||||||||||||||||||||||||||||||||||||||||
| England - Oxford(13) | median 52 (35-76) | 0.78±0.07 | 1993-1999 | 2904 | ||||||||||||||||||||||||||||||||||||||||||||||||||||||||||||||||||||||||||||||||||||||
| Hadza (northern Tanzania)(14) | 22±2.23 (17-24) | 0.79±0.04 (0.72-0.87) | 2005 (p) | 10 | ||||||||||||||||||||||||||||||||||||||||||||||||||||||||||||||||||||||||||||||||||||||
| Hadza (northern Tanzania)(14) | 37.5±16.1 (17-82) | 0.83±0.06 (0.69-0.94) | 2005 (p) | 53 | ||||||||||||||||||||||||||||||||||||||||||||||||||||||||||||||||||||||||||||||||||||||
| Jarawa (Andaman Islands)(15) | 28.2±9.24 (18-50) | 0.82 (0.73-0.95) | 2003 (p) | 15 | ||||||||||||||||||||||||||||||||||||||||||||||||||||||||||||||||||||||||||||||||||||||
| Shiwiar (Ecuador)(16) | 12-70 | 0.87 (0.81-1.02) | 2004 (p) | 28 | ||||||||||||||||||||||||||||||||||||||||||||||||||||||||||||||||||||||||||||||||||||||
| *(p) indicates year of publication, and its absence implies actual period during which the data were gathered. | ||||||||||||||||||||||||||||||||||||||||||||||||||||||||||||||||||||||||||||||||||||||||||
Some studies of indigenous populations (Native American, African) where the women have higher WHRs than European women show that the men in these populations prefer higher WHR values than European men when shown front views of women with varying WHRs,(16-19) though in some cases the preferences for higher WHRs compared to European men correspond to a preference for greater body fat in women,(16, 18) which is again consistent with the naturally higher prevalence of obesity in these indigenous populations, and men, European or non-European, tend to prefer WHRs that are somewhat lower than the population average, thereby indicating a preference for women with above average femininity.(14) Compared to European men, the Hadza prefer higher WHRs in front view, but lower WHRs in side view, which is consistent with the anatomical differences between European and African women (Fig 2).
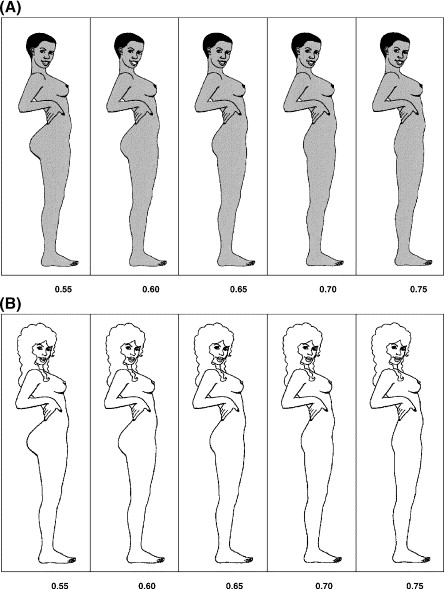
Fig 2. Drawings used to compare profile WHR preferences between European and Hadza men.(14) A, stimuli presented to Hadza men; B, stimuli presented to European men. When asked to rate preferred figure with respect to attractiveness, healthiness and wife-material, on all three counts, the most common first-choice preferred WHR was 0.6 for Hadza men and 0.65 for European men. “Between 17% and 32% of the Hadza selected 0.55 first on one of the three criteria, whereas not a single [white] man in the United States selected 0.55 on any question.”(14)
Therefore, some population differences in aesthetic preferences lie along the lines of anatomical differences between populations, as also shown previously for the shape of the nasal bones in Europeans, which make it difficult to specify exacting aesthetic criteria to compare attractiveness across populations.
Needless to add, but not all of the population differences with respect to WHR can be explained in terms of the extent of feminization. For instance, if one considers Northern European populations, where waist-hip proportions tend to be the most feminine looking, it is not difficult to find masculinized women with waist-hip proportions that look feminine, but it would be incorrect to ascribe the feminine waist-hip-buttocks looks to feminization in these masculinized women (Fig 3a-b), which is somewhat along the lines of finer facial features in Northern Europeans imparting pseudo-femininity to the face.

Fig 3a. Masculinized Northern European; note face shape, broad shoulders and small breasts, but feminine-looking waist-hip proportions.
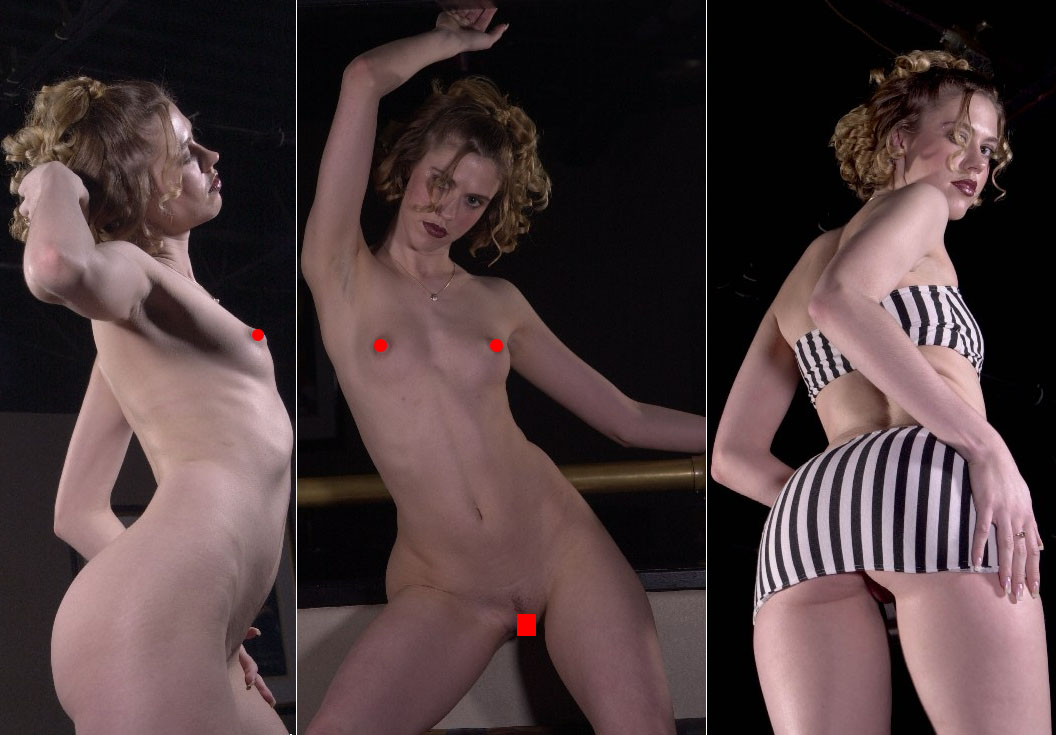
Fig 3a. Masculinized Northern European with feminine-looking waist-hip-buttocks proportions; click image for larger view.
Lower half proportions
For a given height, East Asian populations tend to have shorter legs, African populations longer legs and European populations are intermediate. Even if one were to compare the longer-legged Northern Europeans with sub-Saharan Africans, the muscle structure is notably different. The greater proportion of shorter, fast-twitch muscle fibers in sub-Saharan West Africans(20, 21) translates to shorter calf muscles and narrower soleus muscles, which combined with the more protruding buttocks of sub-Saharan African women, results in a typically sharp contrast with European women (Fig 4a-b).
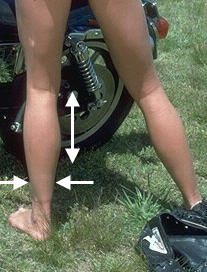
Fig 4a. Calf muscle (gastrocnemius) length and soleus thickness in a typical European.

Fig 4b. The "buttocks-upper leg-lower leg" proportions seen in the African woman are uncommon in European women. Models shown: Boo from cinnamonbunz (left) and cute Kylie.
It would not be possible to come up with "buttocks-upper leg-lower leg" proportions intermediate to sub-Saharan Africans and Europeans as a reference standard for aesthetic comparisons since it is clear that the "buttocks-upper leg-lower leg" proportions considered most pleasing in European women are also very European (Fig 4c), and a shift toward sub-Saharan African norms corresponds to a sharp drop in aesthetic appeal in a European context (Fig 4d-e).

Fig 4c. Very European buttocks and leg muscle structure. Models shown: Holly (left) and Paula from karupspc.

Fig 4d. The attractiveness of the proportions of the buttocks and leg muscles in European women drops rapidly as these proportions approach the norms in sub-Saharan African women. Models shown: Brenda from 21sextury (left), Dani from Domai (middle) and Helena from only tease (links lead to adult sites).

Fig 4e. Leg muscle structure approaching that of sub-Saharan Africans can sharply diminish the appeal of an otherwise attractive white woman; model shown: Jelena Jensen from Pinup files (adult site).
Comment
Let us say that beauty pageant contestants must be 18- to 26-year-olds between 5-foot-6 and 5-foot-10, and are drawn from two populations with average adult female heights of 5-foot-1 and 5-foot-5. Assume that the standard deviation of height in both populations is 2.5 inches and that height is normally distributed in both populations. Thus, the candidates for the pageant will be drawn from 2.26% of 18- to 26-year-olds from the shorter population and 32.18% of the taller population in the same age range. If the number of women in the 18- to 26-year-old range is the same in both populations, the taller population offers a lot more women to choose from, and can therefore be more selective in choosing its candidates. Alternatively, the 5-foot-6 to 5-foot-10 range being closer to the mean of the taller population, a greater proportion of women in this height range will be within normal variation on multiple counts in the taller population, and the taller population will offer a much greater proportion of women among the height eligibles as potential contestants for the pageant. Therefore, if the sizes of these populations are in the millions, then few to none of the contestants from the shorter population will be able to match the attractiveness of the candidates from the taller population, making it difficult to achieve meaningful high profile cross-population aesthetic comparisons in international beauty pageants.
Alternatively, let us address something that is more relevant to a beauty pageant, namely the feminine appearance of the physique of women. Typically, East Asian women (e.g., Fig 5a) are easily outcompeted by European women when it comes to presenting a feminine physique, even if the European women are not particularly feminine (e.g., Fig 5b). However, it is not difficult to find voluptuous East Asian women (Fig 5c), though the woman shown in Fig 5c would need a lot more than mere voluptuousness in order to participate in a high profile beauty pageant; longer legs for instance. On the other hand, if one were to avoid the normally short-legged East Asian women (Fig 5c, leftmost woman in Fig 5d) and seek longer-legged East Asian women, one will be easily successful, but may end up with a woman having a flattened backside (the middle woman in Fig 5d), and even if one manages to find a "long legs-more prominent backside" combination, the woman may be naturally flat-chested (rightmost woman in Fig 5d; flat chest not shown). It would surely not be an easy task to find very many East Asian women with the long-legged and feminine appearance of the European woman shown in Fig 5e.

Fig 5a. Carol from Domai; adult site.

Fig 5b. Inna from Domai; adult site.
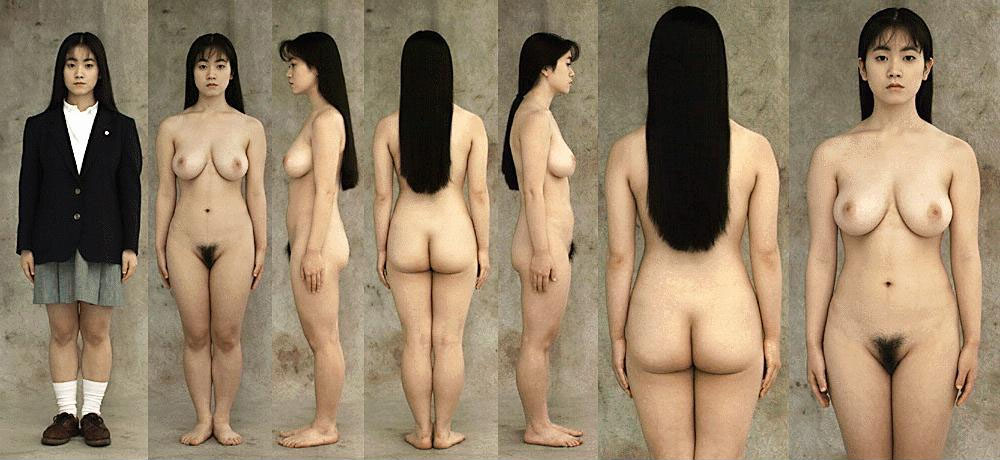
Fig 5c. Voluptuous Japanese; click image for larger version.

Fig 5d. Hiromi Anzai (left), Ai Komori (middle) and Japanese from Met Art (adult site); click for larger image.

Fig 5e. Anna from Domai; adult site.
In summary, it can be appreciated how difficult it is to achieve a meaningful international beauty pageant.
References
- Razak, F., Anand, S., Vuksan, V., Davis, B., Jacobs, R., Teo, K. K., and Yusuf, S., Ethnic differences in the relationships between obesity and glucose-metabolic abnormalities: a cross-sectional population-based study, Int J Obes (Lond), 29, 656 (2005).
- Sekikawa, A., Eguchi, H., Igarashi, K., Tominaga, M., Abe, T., Fukuyama, H., and Kato, T., Waist to hip ratio, body mass index, and glucose intolerance from Funagata population-based diabetes survey in Japan, Tohoku J Exp Med, 189, 11 (1999).
- Berg, C., Rosengren, A., Aires, N., Lappas, G., Toren, K., Thelle, D., and Lissner, L., Trends in overweight and obesity from 1985 to 2002 in Goteborg, West Sweden, Int J Obes (Lond), 29, 916 (2005).
- Kumar, B. N., Meyer, H. E., Wandel, M., Dalen, I., and Holmboe-Ottesen, G., Ethnic differences in obesity among immigrants from developing countries, in Oslo, Norway, Int J Obes (Lond), 30, 684 (2006).
- Misra, A., Wasir, J. S., and Vikram, N. K., Waist circumference criteria for the diagnosis of abdominal obesity are not applicable uniformly to all populations and ethnic groups, Nutrition, 21, 969 (2005).
- Molarius, A., Seidell, J. C., Sans, S., Tuomilehto, J., and Kuulasmaa, K., Waist and hip circumferences, and waist-hip ratio in 19 populations of the WHO MONICA Project, Int J Obes Relat Metab Disord, 23, 116 (1999).
- Thornhill, R., and Grammer, K., The body and face of woman: One ornament that signals quality?, Evol Hum Behav, 20, 105 (1999).
- Chapman, J. F., Determinants of ovarian function in young women. Unpublished Doctoral dissertation., Harvard University, Cambridge, MA (2004).
- Jasienska, G., Ziomkiewicz, A., Ellison, P. T., Lipson, S. F., and Thune, I., Large breasts and narrow waists indicate high reproductive potential in women, Proc Biol Sci, 271, 1213 (2004).
- Lei, S. F., Liu, M. Y., Chen, X. D., Deng, F. Y., Lv, J. H., Jian, W. X., Xu, H., Tan, L. J., Yang, Y. J., Wang, Y. B., Xiao, S. M., Sun, X., Jiang, C., Guo, Y. F., Guo, J. J., Li, Y. N., Liu, Y. J., and Deng, H. W., Relationship of total body fatness and five anthropometric indices in Chinese aged 20-40 years: different effects of age and gender, Eur J Clin Nutr, 60, 511 (2006).
- Shaw, A., McMunn, A., and Field, J., The Scottish Health Survey 1998, National Centre for Social Research and Department of Epidemiology and Public Health, UCL, London (2000).
- Trichopoulou, A., Naska, A., Orfanos, P., and Trichopoulos, D., Mediterranean diet in relation to body mass index and waist-to-hip ratio: the Greek European Prospective Investigation into Cancer and Nutrition Study, Am J Clin Nutr, 82, 935 (2005).
- Spencer, E. A., Roddam, A. W., and Key, T. J., Accuracy of self-reported waist and hip measurements in 4492 EPIC-Oxford participants, Public Health Nutr, 7, 723 (2004).
- Marlowe, F., Apicella, C., and Reed, D., Men's preferences for women's profile waist-to-hip ratio in two societies, Evol Hum Behav, 26, 458 (2005).
- Sahani, R., Nutritional and health status of the Jarawas, J Anthropol Survey India, 52, 47 (2003).
- Sugiyama, L., Is beauty in the context-sensitive adaptations of the beholder? Shiwiar use of waist-to-hip ratio in assessments of female mate value, Evol Hum Behav, 25, 51 (2004).
- Yu, D. E., and Shepard, G. H., Is beauty in the eye of the beholder?, Nature, 396, 321 (1998).
- Wetsman, A., and Marlowe, F. W., How universal are preferences for female waist-to-hip ratio? Evidence from the Hadza of Tanzania, Evol Hum Behav, 20, 219 (1999).
- Marlowe, F. W., and Wetsman, A., Preferred waist-to-hip ratio and ecology, Personal Individ Diff, 30, 481 (2001).
- Tanner, C. J., Barakat, H. A., Dohm, G. L., Pories, W. J., MacDonald, K. G., Cunningham, P. R., Swanson, M. S., and Houmard, J. A., Muscle fiber type is associated with obesity and weight loss, Am J Physiol Endocrinol Metab, 282, E1191 (2002).
- Suminski, R. R., Mattern, C. O., and Devor, S. T., Influence of racial origin and skeletal muscle properties on disease prevalence and physical performance, Sports Med, 32, 667 (2002).