Let us address facial proportions in a sample of 1470 healthy individuals (750 men, 720 women), aged 18-30, from Europe (780 participants from Azerbaijan, Bulgaria, Croatia, Czech Republic, Germany, Greece, Hungary, Italy, Poland, Portugal, Russia, Slovakia and Slovenia), the Middle East (180 participants from Egypt, Iran, Turkey), Asia (300 participants from India, Japan, Chinese from Singapore, Vietnam and Thailand) and Africa (210 participants from Angola, the Tonga and Zulu nations of Africa, and African-Americans from the United States).(1)
Although this study by Farkas et al. evaluated crude indices of facial proportions and reported measurements without adjusting for face/body size, it focused on the clearly visually distinct differences across populations. Thus, a measurement difference was considered statistically significant only if the probability that the difference was due to chance was less than or equal to 0.9% (typical value is 5%); if this value was between 0.9% and 0.1%, then the difference was considered very significant and if this value was less than 0.1%, then the difference was considered extremely significant.
In each participating nation 30 men and 30 women (omitted in the Tonga nation) were examined by physical anthropologists, anatomists, plastic surgeons or dentists working in university hospitals and medical institutes. Therefore, there is some question as to how random the sampling was, but the dataset is in the process of being expanded and does reveal some differences that should be common observation.
The results are in this pdf file, but some significant visually striking differences can be addressed here. Compared to North American whites, the nose was much broader in East Asians and sub-Saharan Africans, the nose was longer and more prominent in Middle Eastern and Southern European populations (Greeks), the eyes were spaced farther apart in East Asians and some Middle Eastern populations, and the face was broader in East Asians. These differences should be well known, but clearer data from skeletal studies show somewhat broader faces and wider-spaced eyes in sub-Saharan Africans, too,(2) weaker chin development in Middle Eastern and Southern European populations compared to Northern Europeans (a trend toward this difference is seen in the Farkas et al. study) and somewhat longer noses (relative to face size) in Northern Europeans compared to sub-Saharan Africans, Australian aborigines and East Asians.(2)
Data concerning differences in some facial proportions between the average Korean-American woman and the average North American white woman are shown below.(3) The landmarks assessed as well as the outline of the average Korean-American woman are shown in Fig 1a. The differences are shown in Table 1; differences where p > 0.05 should not be considered statistically significant.
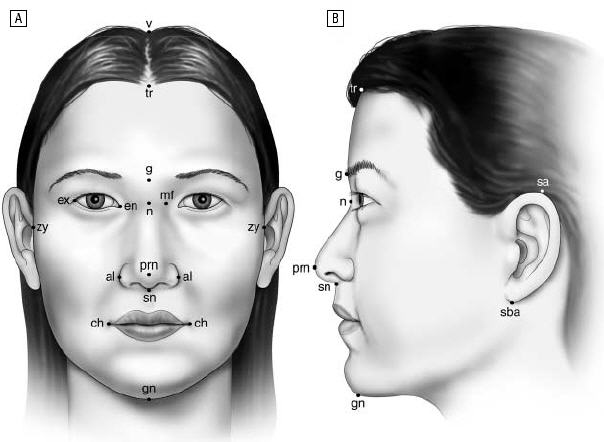
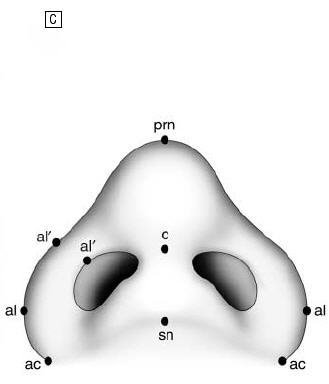
Fig 1a. Frontal (A), lateral (B), and basal (C) views of the average Korean-American woman’s face. ac indicates alar curvature point; al, alare; al', alar rim; c, highest point of the columella; ch, cheillion; en, endocanthion; ex, exocanthion; g, glabella; gn, gnathion; mf, maxillofrontale; n, nasion; prn, pronasale; sa, superaurale; sba, subaurale; sn, subnasale; tr, trichion; and zy, zygion.(3)
Table 1. Comparison of anthropometric facial measurements in Korean-American and North American white women.(3, 4, 5) |
 |
Abbreviations: ac, alar curvature point; al, alare; al', alar rim; c, highest point of the columella; ch, cheillion; en, endocanthion; ex, exocanthion; g, glabella; gn, gnathion; mf, maxillofrontale; n, nasion; prn, pronasale; sa, superaurale; sba, subaurale; sn, subnasale; tr, trichion; v, vertex; zy, zygion. *Unless otherwise noted, data are in millimeters. |
Data concerning differences in some facial proportions between the average African-American woman and the average North American white woman are shown below. The landmarks assessed as well as the outline of the average African-American woman are shown in Fig 1b. The differences are shown in Table 2.
Fig 1b. Front and side views of the average African-American woman.(6)
| Table 2. Comparison of anthropometric measures in young African-American women and young North American white women.*(6) |
 |
The front, lateral and basal views of the average North American white woman are shown in Fig 1c.
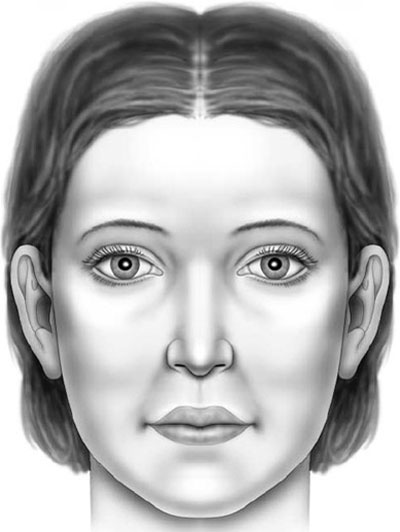
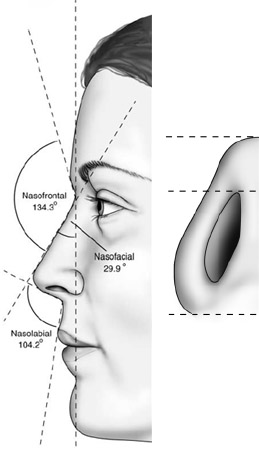
Fig 1c. Front, lateral and basal views of the average North American white woman.(4, 5)
Europeans have smaller faces than most non-European populations, on average, in spite of being taller and heavier than many non-European populations, though the face size of some non-European populations is smaller than in Europeans, which is an artifact of small body size (Table 3).
| Table 3. Mean facial centroid size (in cm) of 10 populations, sexes pooled; higher values imply larger faces.(7)* | |
| Polynesian | 25.334 |
| Papua New Guinean | 22.542 |
| Australian | 23.494 |
| Egyptian | 24.096 |
| Alaskan | 24.456 |
| Ashanti | 23.211 |
| Aleutian | 25.404 |
| African-American | 24.080 |
| Arikara | 24.043 |
| White Canadian | 23.063 |
| * Excluding the lower jaw. | |
Now, let us address the neoclassical canons of facial beauty, which have their origins in the works of Renaissance artists -- e.g., Leonardo DaVinci, Albrecht Dürer -- and were based on classical Greek canons; these canons were meant to guide artists. The neoclassical canons are described below and shown in Figures 1d-f.
The 9 neoclassical canons comprise of 4 vertical measures (canons 1-IV), 4 horizontal measures (canons V-XIII) and an angle of inclination (canon IX). The formulae for the 9 canons are: canon I, 2-section facial profile (vertex-endocanthion = endocanthion-gnathion); canon II, 3-section facial profile (trichion-nasion = nasion-subnasale = subnasale-gnathion); canon III, 4-section facial profile (vertex-trichion = trichion-glabella = glabella-subnasale= subnasale-gnathion); canon IV, nasoaural proportion (superaurale-subaurale = nasion-subnasale); canon V, orbitonasal proportion (endocanthion-endocanthion = alare-alare); canon VI, orbital proportion (exocanthion-endocanthion= endocanthion-endocanthion); canon VII, naso-oral proportion ([alare-alare] x 1.5 = cheilion-cheilion); canon VIII, nasofacial proportion ([zygion-zygion] x 0.25 = alare-alare); and canon IX, nasoaural inclination (nasal bridge inclination = ear inclination).
Fig 1d. The facial proportions involved in the four vertical neoclassical canons of facial beauty.(6)
Fig 1e. The facial proportions involved in the four horizontal neoclassical canons of facial beauty.(8)
Fig 1f. The nasoaural neoclassical canon of facial beauty; figure from Farkas et al.(9)
In the study summarized in Fig 1a and Table 1, fewer Korean-American women than North American white women satisfied the neoclassical canons of facial beauty (Table 4).
| Table 4. The neoclassical facial canon measurements in Korean-American women and North American white women.(3)* |
 |
Abbreviations: al, alare; ch, cheillion; en, endocanthion; ex, exocanthion; g, glabella; gn, gnathion; sn, subnasale; tr, trichion; zy, zygion. *Unless otherwise noted, data are number (percentage) of subjects. †P values were calculated by 2-tailed Fisher exact test. |
In the study summarized in Fig 1b and Table 2, few African-American women satisfied the neoclassical canons of facial beauty (Table 5).
| Table 5. The neoclassical facial canon measurements in a sample of young African-American women.(6) |
 |
In a study comparing the proportions of East Asians and North American whites that satisfied the neoclassical canons of facial beauty, far fewer East Asians satisfied the canons (Table 6).
| Table 6. The validity of the neoclassical canons of facial proportions among Singapore-Chinese, Vietnamese, Thais and North American whites.(8) |
 |
In a study comparing the proportions of African-Americans and North American whites that satisfied the neoclassical canons of facial beauty, far fewer African-Americans satisfied the canons (Table 7).
| Table 7. The validity of the neoclassical canons of facial proportions among African-Americans and North American whites.(9) |
|
It should not be surprising that few non-whites satisfy a set of canons most applicable to whites, but setting aside the issue of the validity of the neoclassical canons, these canons are crude measures and are not informative about the subtlety of aesthetics, an example of which can be addressed by considering some elements of the aesthetics of the nasal bones in Europeans.
In Tables 3 and 4 on the first page of this part of the site, underlying factors (principal components) were extracted from 54 craniofacial shape variables across 1,734 skulls from 6 geographic regions, comprising of a total of 18 populations.(10) The first two principal components (PC1 and PC2) were mainly related to the nasal bones. PC1 mainly reflected the extent of projection of the nasal bones and the breadth of the upper nasal region, and most strongly contrasted Europeans from East Asians. PC2 most strongly separated populations with a broad and flat upper nasal region (sub-Saharan Africans) from populations with a narrow and projecting upper nasal region (Some Polynesian and Native American groups). A plot of PC1 with PC2 is shown in Fig 2a.
Fig 2a. Population variation in the breadth and projection of the upper nasal bones. “Plot of PC2 against PC1. Europeans (EU, population mean; thin, dash-dot line, density ellipse) and East Asians (FE, population mean; thin, long dashed line, density ellipse) show greatest separation along PC1. Polynesians (PO, population mean; thick, short dashed line, density ellipse) and Americans (AM, population mean; thick, long dashed line, density ellipse) contrast most strongly with Sub-Saharan Africans (SS, population mean; thick solid line, density ellipse) along PC2. However, all regional means are fairly well-separated from the Sub-Saharan African mean. AU, Australasian population mean; thin solid line, density ellipse.”(10)
The aesthetics of the nasal bones in Europeans needs to take into account the narrowing of the craniofacial haft in Europeans;(2) the craniofacial haft is the interorbital pillar of bone, i.e., the bony part between the orbits, of which the nasal bones are a part of.
Thus, in Fig 2b, the thickening of the upper nasal region and its projection are related to PC1 in Fig 2a, and the narrowing of the lower part of the nasal bones and flattening of the sides of the nasal bones and associated parts of the maxillary bones are related to the narrowing of the craniofacial haft and gracilization.
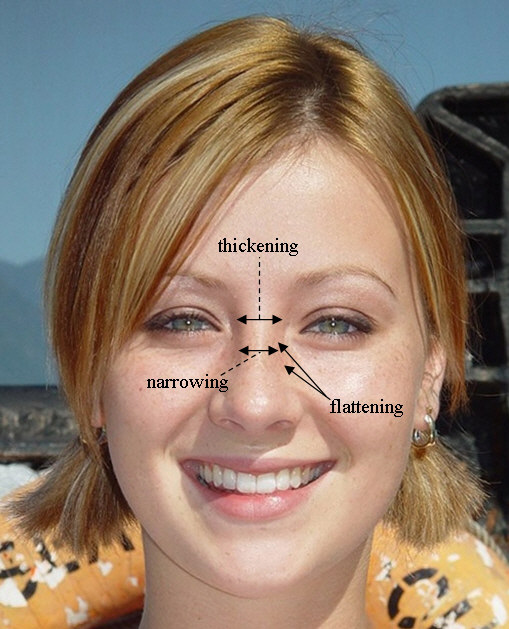
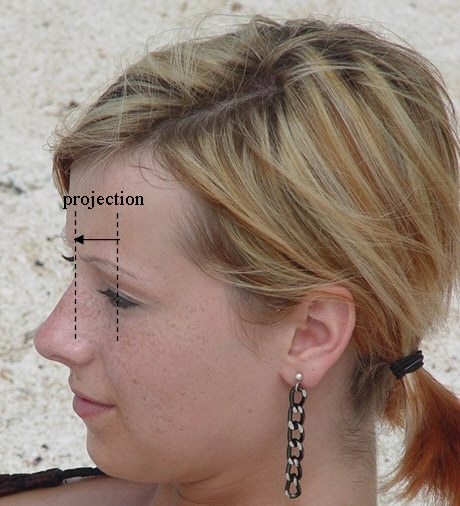
Fig 2b. Some facial elements involved in the aesthetics of the nasal bones in Europeans; Lindsey Marshal.
The facial elements marked in Fig 2b can be used to evaluate the aesthetics of the nasal bones in European women, as addressed in the legends of Figures 3a-g.

Fig 3a. The woman shown on the left (high-fashion model) has nasal bones shifted toward non-European features on all four counts in Fig 2b. The woman to the right (Stacy Keibler) has an appropriately thickened upper nasal region, but features shifted toward non-Europeans on the two remaining measures in the top illustration of Fig 2b, and her less projecting nasion [compared to the surrounding elements of her face] in comparison to the woman shown in Fig 2b is partly related to greater masculinization.
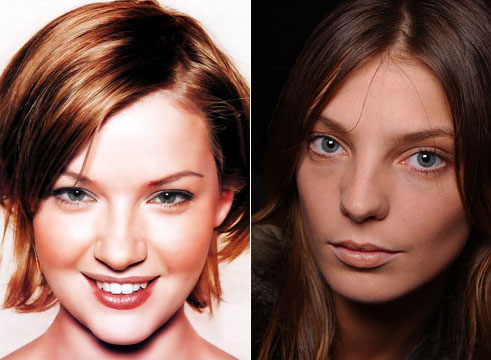
Fig 3b. Both women shown have fully European-shaped nasal bones on all counts except for flattening of the sides of the nasal bones, but the woman on the right has an excessively thickened upper nasal region -- from an aesthetics perspective. The woman shown to the left is Gretchen Mol and the woman on the right is Daria Werbowy.
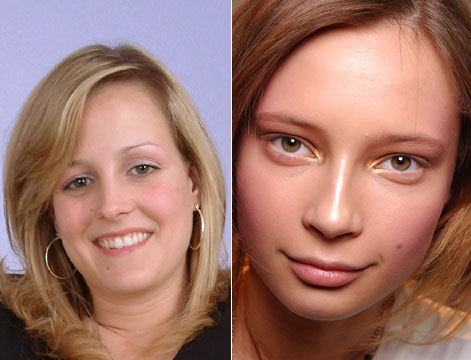
Fig 3c. Women with a very European nasal bone shape. The woman on the left is Caley from ATK galleria (adult site) and the woman on the right is Tiiu Kuik.

Fig 3d. Masculinized women with a very European nasal bone shape; the woman shown on the left has nasal bones that are asymmetric in the sagittal plane and have some other anomalies, and her selection is to underscore the point that the extent of Europeanization is not sufficient when it comes to evaluating the aesthetics of the nasals in Europeans. Note the angularization of the nasal bones in these two women compared to the softer lines of the feminine woman with a very European nasal bone shape in Fig 2b. Since Europeanization causes increased angularization but so does masculinization, there is a confound here, and a preference for Europeanized facial features on the part of some Europeans may result in their preferring more angular very-European-shaped nasal bones over softer-lined very-European-shaped nasal bones, without this preference being related to a preference for masculinization. The model on the left is Susie from Abby Winters (adult site) and the one on the right is Trista from Matts models (adult site).
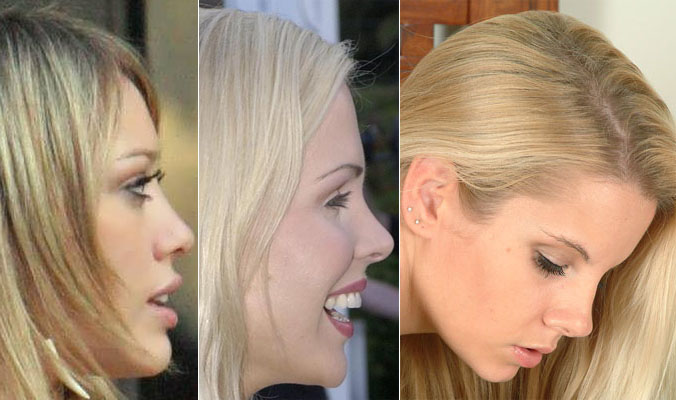
Fig 3e. From an aesthetics perspective, the nasal bones in the women on the left and right are too flat [more non-European] and excessively projecting, respectively, but just about right in the woman shown in the middle. Shown from left: Hilary Duff, Ariane Sommer and Nikki from ATK galleria (adult site).

Fig 3f. Fine nasals; Mandy from Matts models (adult site).
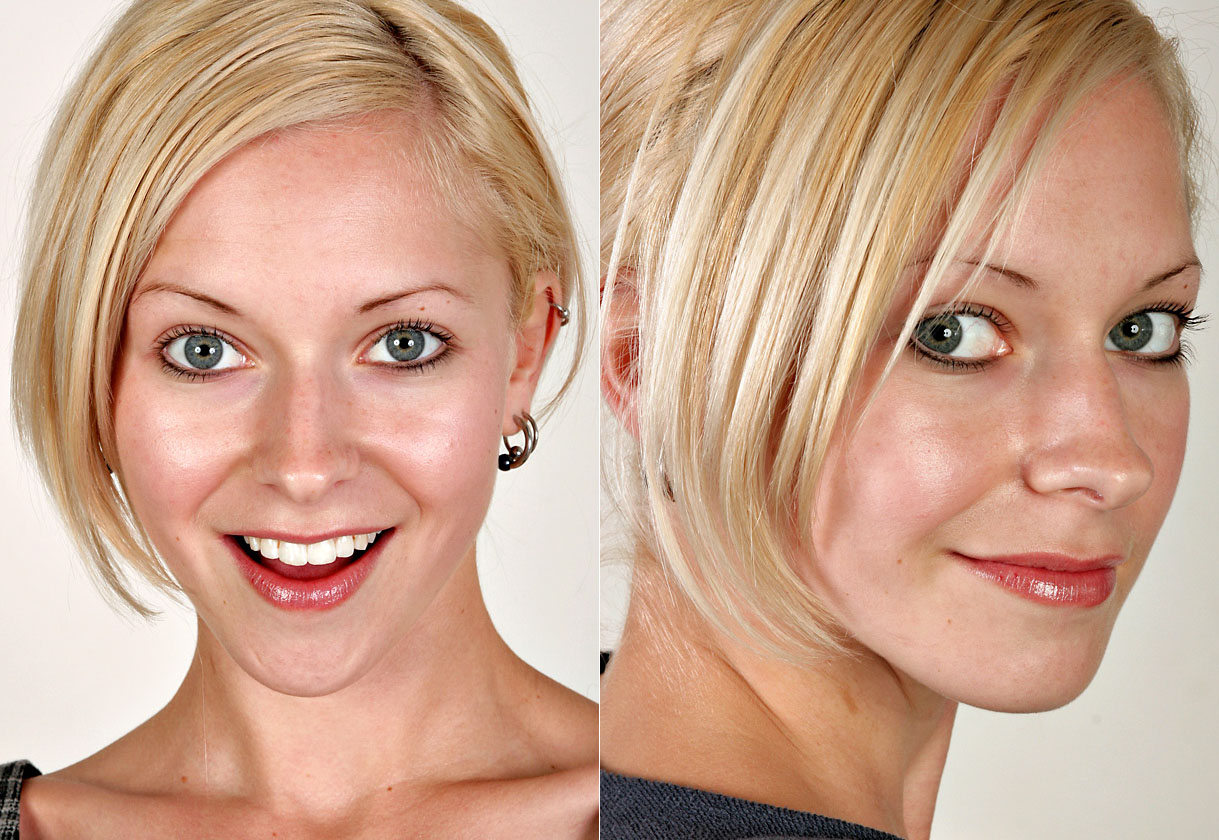
Fig 3g. The importance of having fine nasal bones. The woman shown has a pinched upper nasal region, non-flattened sides of the nasal bones and a non-straight nose in profile view. These aesthetically unacceptable features would look much worse if the woman had thicker nasal bones. The model shown is Ashlynn from ATK galleria (adult site); click image for larger version.
A few points about the aesthetics of the nasal bones in Europeans should be clear. The aesthetically acceptable range is a subset of normal variation. There is an overlap between variation in the shape of the nasal bones between Europeans and non-Europeans, and the subset of normal variation in Europeans that is aesthetically acceptable is shifted toward the more European subset, but it does not necessarily follow that more European equals more aesthetically pleasing since there is an upper limit to the extent of Europeanization that remains aesthetically pleasing.
Now, let us revisit the simotic index, i.e., the extent of flattening of the nasal bones in the sagittal plane (Fig 7b on page 2); this index was normally distributed in Hanihara’s study. The means and standard deviations of this index for Norwegians, Palestinians, Moroccans and South Asians from Delhi (India) are listed in Table 7, and the probability density function of the normal distribution of the simotic index in Norwegians is shown in Fig 4. The select non-European populations have been chosen because their facial features are not as different from Europeans as those in East Asians or sub-Saharan Africans. Let us arbitrarily designate a simotic index (simotic subtense/simotic chord) in the range 55-62 as both very European and also aesthetically acceptable in a European context, and compute the proportion of people in each population that will have a simotic index in this range. This proportion is twice as high in Norwegians compared to the other populations. On the other hand, if all indices of nasal measurements in Fig 2b are addressed, then the proportion of Norwegians that will be in the aesthetically acceptable range will drop, and much more so in the non-European populations.
| Table 7. The simotic index (extent of flattening of the nasal bones in sagittal plane) in selected populations (full data set in this pdf file); lower values imply greater flattening. | |||
| Population | Simotic index | Standard deviation | Percentage population* |
| Norwegians | 52.0 | 10.20 | 22.10% |
| Palestinians | 46.1 | 8.67 | 11.9% |
| Moroccans | 43.2 | 9.96 | 8.9% |
| South Asians (Delhi, India) | 42.3 | 13.20 | 10.2% |
| * Percentage population having a simotic index in the range 55-62. | |||
Fig 4. Probability density function of the normal distribution of the extent of sagittal-plane-flatness of the nasal bones in Norwegians (data from Tsunehiko Hanihara). The average (mu) value of the simotic index was 52.0 and the standard deviation (sigma) was 10.20. The blue part depicts the proportion of people in a very European and aesthetically acceptable range (range arbitrarily selected but is in accordance with the inference from a visual inspection of Figures 3a-g).
The nasal bones only partly shape the nose, and the aesthetics of the cartilaginous part of the nose in Europeans has not yet been addressed. Therefore, it should be clear that crude assessments as in the neoclassical canons of facial beauty are not sufficient for exacting assessments of physical attractiveness, but to specify more exacting standards is to also further lessen the already-low population overlap with respect to those who satisfy these standards.
Comment
Population variation in the front view of the face does not help, either, when it comes to formulating “ideal facial proportions” that apply across populations.
References
- Farkas, L. G., Katic, M. J., Forrest, C. R., Alt, K. W., Bagic, I., Baltadjiev, G., Cunha, E., Cvicelova, M., Davies, S., Erasmus, I., Gillett-Netting, R., Hajnis, K., Kemkes-Grottenthaler, A., Khomyakova, I., Kumi, A., Kgamphe, J. S., Kayo-daigo, N., Le, T., Malinowski, A., Negasheva, M., Manolis, S., Ogeturk, M., Parvizrad, R., Rosing, F., Sahu, P., Sforza, C., Sivkov, S., Sultanova, N., Tomazo-Ravnik, T., Toth, G., Uzun, A., and Yahia, E., International anthropometric study of facial morphology in various ethnic groups/races, J Craniofac Surg, 16, 615 (2005).
- Hennessy, R. J., and Stringer, C. B., Geometric morphometric study of the regional variation of modern human craniofacial form, Am J Phys Anthropol, 117, 37 (2002).
- Choe, K. S., Sclafani, A. P., Litner, J. A., Yu, G. P., and Romo, T., 3rd, The Korean American woman's face: anthropometric measurements and quantitative analysis of facial aesthetics, Arch Facial Plast Surg, 6, 244 (2004).
- Farkas, L. G., Hreczko, T. A., Kolar, J. C., and Munro, I. R., Vertical and horizontal proportions of the face in young adult North American Caucasians: revision of neoclassical canons, Plast Reconstr Surg, 75, 328 (1985).
- Farkas, L. G., Kolar, J. C., and Munro, I. R., Geography of the nose: a morphometric study, Aesthetic Plast Surg, 10, 191 (1986).
- Porter, J. P., and Olson, K. L., Anthropometric facial analysis of the African American woman, Arch Facial Plast Surg, 3, 191 (2001).
- Vioarsdottir, U. S., O'Higgins, P., and Stringer, C., A geometric morphometric study of regional differences in the ontogeny of the modern human facial skeleton, J Anat, 201, 211 (2002).
- Le, T. T., Farkas, L. G., Ngim, R. C., Levin, L. S., and Forrest, C. R., Proportionality in Asian and North American Caucasian faces using neoclassical facial canons as criteria, Aesthetic Plast Surg, 26, 64 (2002).
- Farkas, L. G., Forrest, C. R., and Litsas, L., Revision of neoclassical facial canons in young adult Afro-Americans, Aesthetic Plast Surg, 24, 179 (2000).
- Roseman, C. C., and Weaver, T. D., Multivariate apportionment of global human craniometric diversity, Am J Phys Anthropol, 125, 257 (2004).