Population variation in the facial profile
If it is meaningful to talk about ideal facial proportions that apply across populations, the difficulty of defining what these are can be seen by addressing population variation in profile view. The profile view shows great variation with respect to facial flatness across populations. The facial flatness data mentioned here are from a study of 112 populations by Tsunehiko Hanihara;(1) the details are in this pdf file.
The Infraglabellar notch

Fig 1a. The infraglabellar notch.
The depth of the infraglabellar notch is calculated by dividing the glabella-opisthocranion length by the nasion-opisthocranion length. The opisthocranion is the maximal occipital point in the image below.

Fig 1b. Some anatomical landmarks of the skull referenced on this page (source).
Population variation with respect to the depth of the infraglabellar notch is shown below.
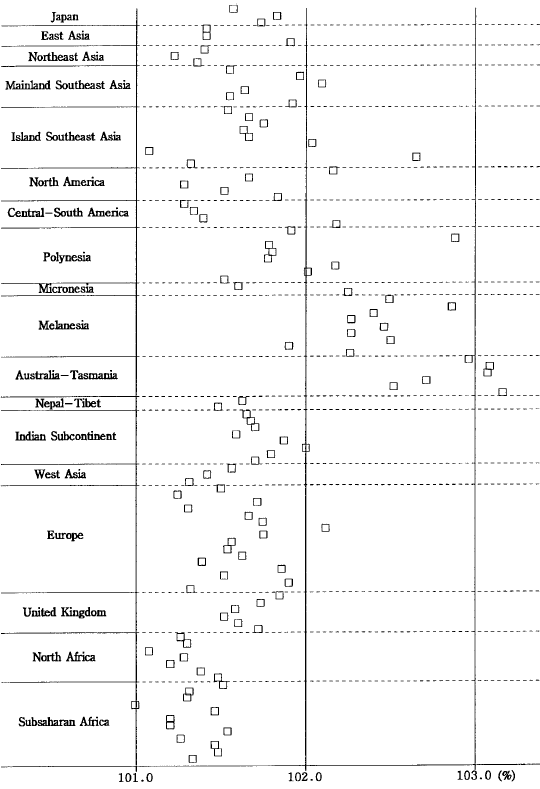
Fig 1c. The depth of the infraglabellar notch across 112 populations.(1)
The infraglabellar notch is deepest in Australian aborigines and Melanesians, and smoothest in sub-Saharan Africans. “A few populations originally derived from eastern Asia, such as the Nicobarese and the Easter Island samples, and to a lesser extent the Eskimo and the Fuegian-Patagonian samples, show deep infraglabellar notches.”(1)
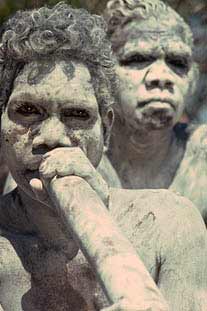
Fig 1d. An illustration of the depth of the infraglabellar notch in Australian aborigines.
Now, what depth of the infraglabellar notch is aesthetically acceptable? Specifying the aesthetically acceptable range toward one extreme does not do justice to the other extreme, and specifying this range in the middle of the species range may be aesthetically unacceptable to one or more populations at the extremes, but the more important question is what objective criteria can be used to pick one portion of the species range over another? It is difficult to imagine what these criteria could be.
Note that the infraglabellar notch becomes deeper with masculinization, too. Therefore, this is one example of a confound between trait variation resulting from sex hormones and genetics unrelated to sex hormones. In other words, an Australian aboriginal woman can easily possess a deeper infraglabellar notch than a sub-Saharan African man, but it would be incorrect to assume that the aboriginal woman is somehow more masculine than the African man. Additionally, the depth of the infraglabellar notch in Australian aboriginal women may appear to be too masculine-looking to men from other populations.
Alveolar index (prognathism; the extent of jaw projection)
The alveolar index is based on dividing the basion-prosthion length by the basion-nasion length (markers shown in Fig 1b and Fig 2a).
The basion is marked in the image below (point Ba); it is the mid-front point of the big hole at the bottom of the skull through which the spinal chord passes (foramen magnum).
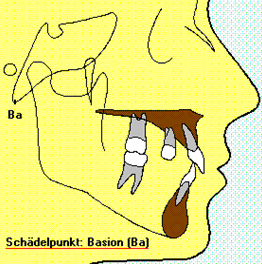
Fig 2a. The location of the basion (point Ba).
Population variation with respect to the alveolar index is shown below.
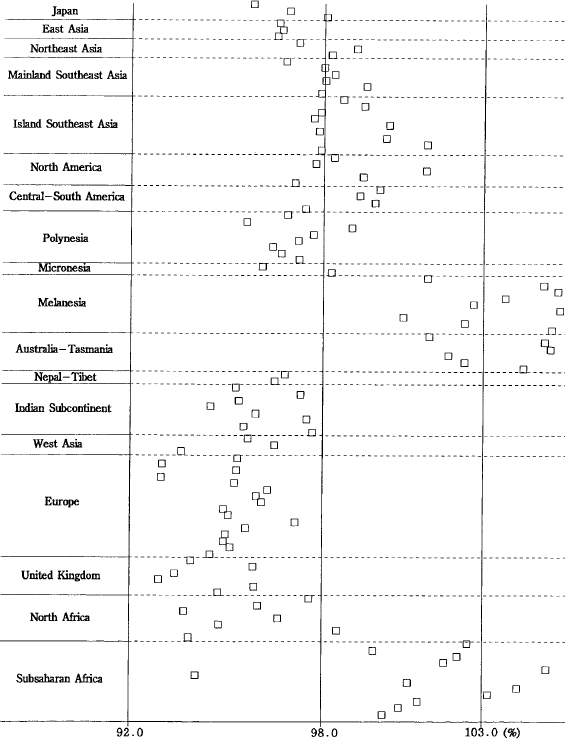
Fig 2b. The extent of jaw protrusion across 112 populations.(1)
The greatest contrast when it comes to jaw protrusion is between Europeans on the one hand and sub-Saharan Africans, Australian aborigines and Melanesians on the other hand; an example of striking contrasts between European women and sub-Saharan African women is shown in Fig 2c.
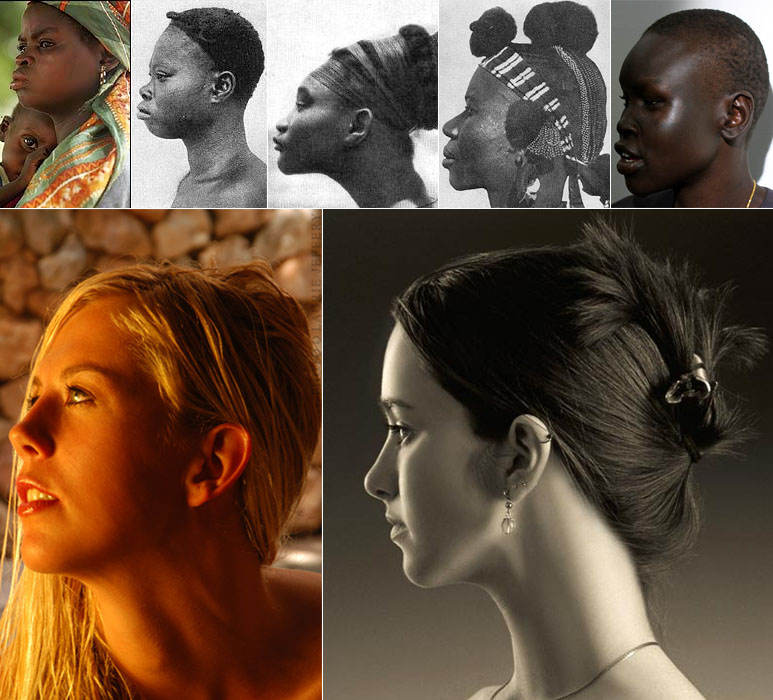
Fig 2c. Striking differences between facial prognathism of sub-Saharan Africans and Europeans. Click on image for larger view. The European woman on the left is Dafne from Nude Illusion (adult site) and the one on the right is Sabrina from Domai (adult site).
Whereas I could not find a clear profile view of an Australian aborigine woman, Fig 2d shows an example of the difference between a European male and an Australian aborigine with respect to jaw protrusion.
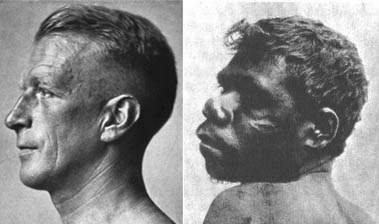
Fig 2d. A European and an Australian Aborigine.
Once again, what range of jaw projection is aesthetically acceptable, what objective criteria can be used to arrive at this range, and how can this range be fair to all human populations?
Fig 2e shows regional variation in lower jaw shape across some continental populations of the Old World.

Fig 2e. Lower jaw variation across continents; click image for larger version. The placement of illustrative examples (pictures of actual people) is not fine tuned to the first two relative warps; first relative warp (x-axis) reflects narrow and broad mandibular rami; second relative warp (y-axis) shows mostly vertical shape variation.(2) Rami is plural for ramus, and the mandibular ramus is the vertical portion of the lower jaw in the position shown.
The problem of specifying an aesthetically acceptable range in between the extremes seen in the human species is shown in Fig 2f, which shows two masculinized white women; the one on the right clearly having a more European lower jaw by virtue of its stronger development of the chin and weaker development at the gonial region. Within a European, especially Northern European context, the lower jaw of the model shown to the left cannot be seen as aesthetically acceptable, and a more feminine version of the European lower jaw in the woman shown to the right will be preferred, but to specify an aesthetically acceptable range in between the extremes seen in the human species -- so as to be maximally fair to most populations -- is to accept white women with a less European-looking jaw, which in turn is to make the European population at-large start losing interest in beauty pageants, and of course, also not do any justice to the more aesthetically pleasing white women.

Fig 2f. Two masculinized women; Stacy Keibler (left) and Joceline from only tease (adult site); click image for larger version; see text for context.
Sagittal frontal index
The sagittal plane divides the face/body into left and right portions (Fig 3a). The sagittal frontal index is a measure of how flattened or rounded the forehead (frontal bone) is in the sagittal plane or profile view, and is calculated by dividing the sagittal frontal chord by the sagittal frontal arc (Fig 3b explains the difference between a chord and an arc). The sagittal frontal chord is the distance between the nasion and bregma (both markers are shown in Fig 1b). In Fig 4, lower values of this index imply flatter foreheads in profile view and higher values imply rounder foreheads in profile view.

Fig 3a. The sagittal or median plane.
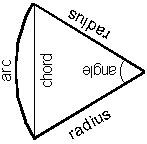
Fig 3b. An arc is the curved length and a chord is the straight line length between two points.
Population variation with respect to the extent of forehead flatness in profile view is shown below.
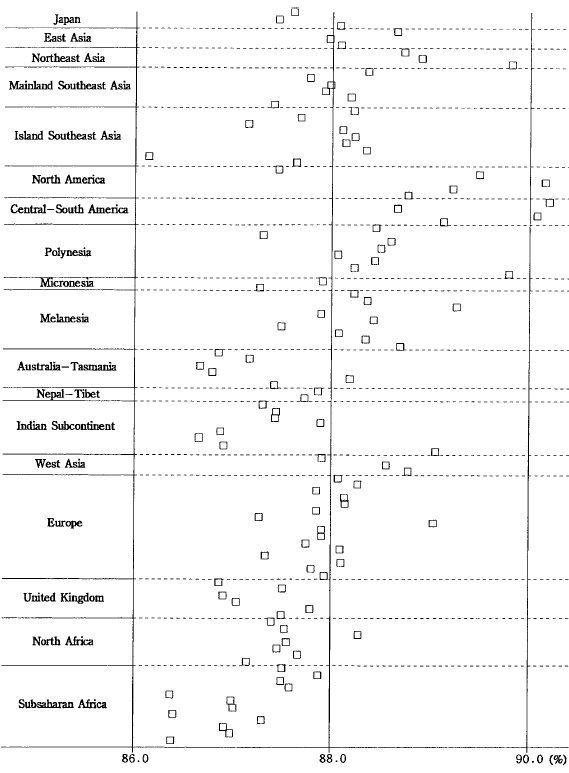
Fig 4. Population variation in sagittal frontal index.(1)
“Among the 17 regional samples, the Australian samples have, on average, flat frontal bones. However, the Southeast Asian Nicobarese sample shows the flattest frontals, followed by three samples from sub-Saharan Africa (the Congo, the Tanzania, and the Khoi-San samples). It should be noted that the South Indian Dravidian sample together with the Veddah and the northwest Indian samples have flatter frontal bones than many of the Near East, north African, and European samples. The groups with the opposite condition, or rounded frontal bones, are, on average, New World samples except for the Eskimo sample, and the northeast Asian samples.”(1)
The three remaining indices of facial flatness -- frontal index, simotic index and zygomaxillary index -- are measures of flatness in the transverse plane (Fig 5).

Fig 5. The transverse or horizontal or axial plane.
Frontal index (fronto-orbital flatness)
This index is obtained by dividing the nasion subtense by the inner biorbital breadth. The nasion is marked in Fig 1b. A subtense is a line subtending or stretching across. The orbits are the bony eye sockets.
Population variation with respect to the extent of flatness of the orbital (eye socket) region in the transverse plane is shown below.
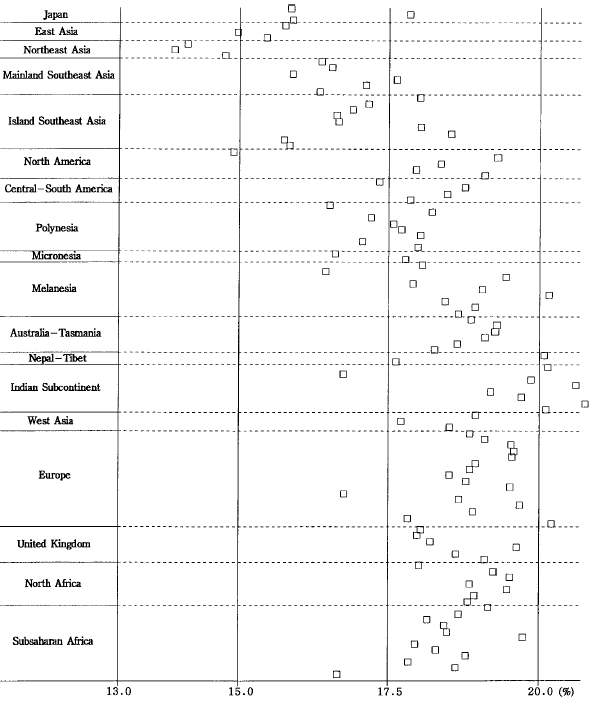
Fig 6a. Fronto-orbital flatness across 112 human populations.(1)
“The northeast Asian samples and to a lesser degree the east Asian samples, except for the Ainu, show the smallest mean values, i.e., the flattest faces in the fronto-orbital portion. The degree of fronto-orbital flatness is weaker in the Australian/Melanesian samples than in the east/northeast Asian samples. The series from southeast Asia exhibits intermediate values, indicating a roughly clinal variation. With the possible exception of the Eskimo sample, the New World samples show a less flattened fronto-orbital region, comparable to the Australian and the Melanesian samples. In the western hemisphere of the Old World, no significant difference in the degree of fronto-orbital flatness can be detected, thereby showing projecting faces in these populations.”(1)

Fig 6a. Fronto-orbital flatness in a Northeastern Asian; Carol from Domai (adult site).
Simotic index (flatness of nasal bones)
This index is obtained by dividing the simotic subtense by the simotic chord. The simotic chord is the least nasal breadth (across the two nasal bones; nasal bones are shown in Fig 7a) in the transverse plane. The simotic subtense is the subtense from the nasal bridge to the simotic chord, i.e., from the highest point in the transverse section which is at the deepest point in the nasal profile (side view).
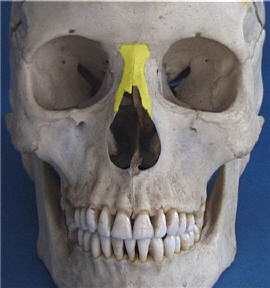
Fig 7a. The nasal bones; marked in yellow (source).
Population variation in the extent to which the nasal bones are flattened is shown below.
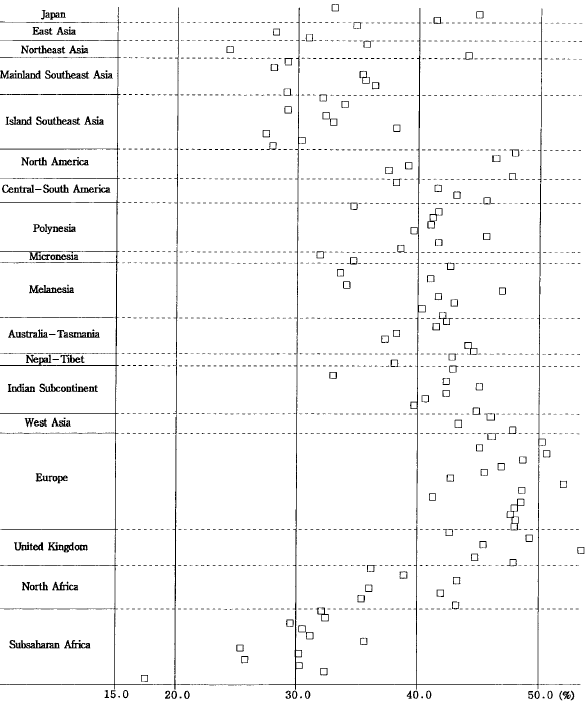
Fig 7b. Population variation in the simotic index.(1)
“The sub-Saharan African samples have very flat nasals, especially the Khoi-San sample. Of all the samples examined, the European samples show the highest nasals, followed by the Indian subcontinent samples, the Oceanian samples, and, very significantly, the New World samples and the Ainu sample from Japan. As is well known, the nasal form of Eskimos and, to a lesser extent, Chukchis shows what has been referred to as ‘‘pinched nasalia,’’ a condition which is characterized by a narrow nasal chord and high subtense.”(1)
In the pictures below, extreme contrasts between populations are shown for populations with the flattest nasal bones -- sub-Saharan Africans (Figures 7c-f) and Northeastern Asians (Fig 7g) -- and populations with the most prominent nasal bones, i.e., Northern Europeans (Fig 7h). The prominence of the nasal bones should not be confounded with the prominence of the nose. As is well known, the most prominent noses are found in Southern Europeans (Greeks) and Middle Eastern populations,(3, 4) but these populations have flatter nasal bones than Northern Europeans.

Fig 7c. A !Kung woman; Southern Africa.
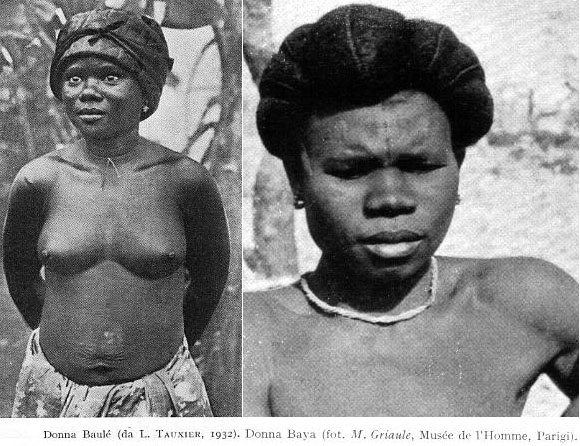
Fig 7d. Central Africans.
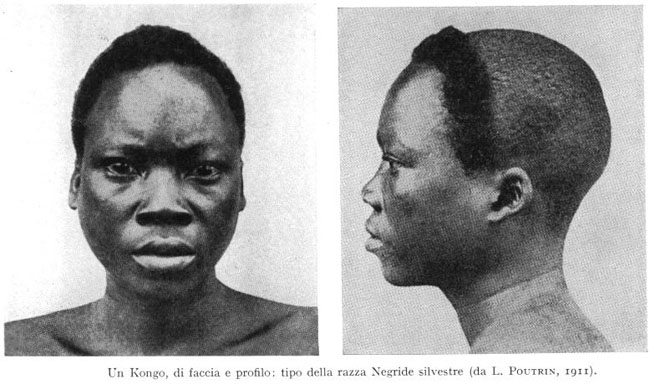
Fig 7e. Congolese.
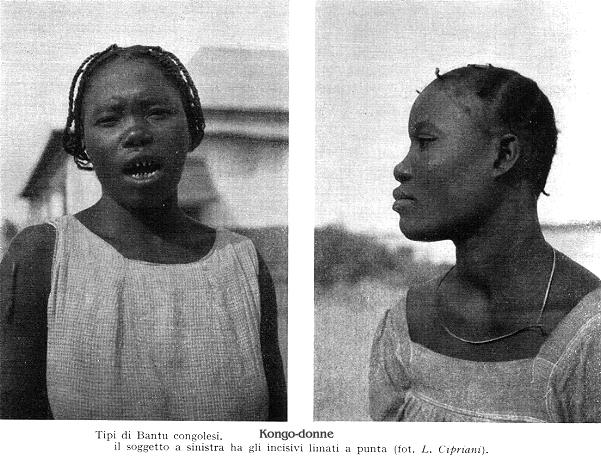
Fig 7f. Congolese.

Fig 7g. Chinese; Zhang from Simonscans (adult site).

Fig 7h. Northern European; Melissa from FTV girls (adult site).
Zygomaxillary index (mid-facial flatness)
This index is obtained by dividing the zygomaxillary subtense by the zygomaxillary chord. The zygomaxillary subtense is the projection or subtense from subspinale to the bimaxillary breadth. The maxillary bones are shown in Fig 8a. The subspinale is shown in Fig 8b.
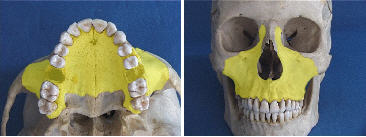
Fig 8a. The maxillary bones; marked in yellow (source).
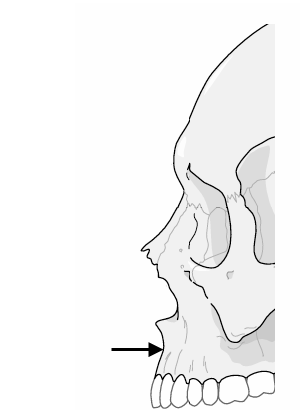
Fig 8b. The subspinale.
Population variation with respect to mid-facial flatness is shown below.
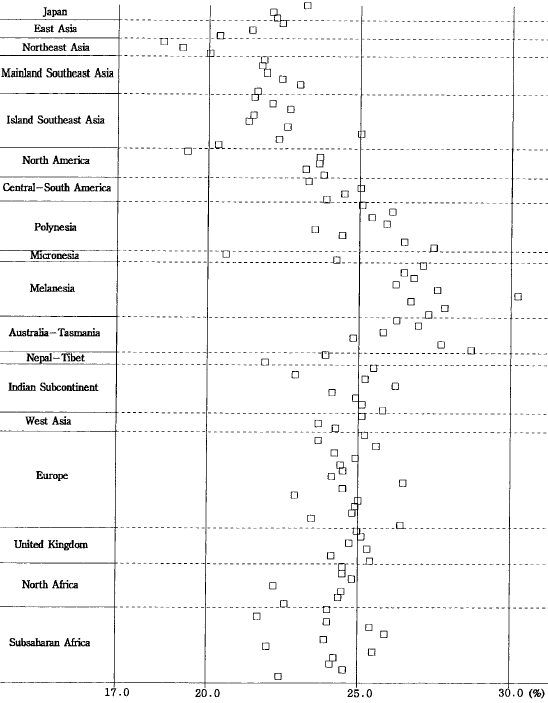
Fig 8c. Population variation in the zygomaxillary index.(1)
“As in the case of the frontal index, the northeast Asian samples and to a lesser degree the east Asian samples show the smallest mean values of the zygomaxillary index, indicating the flattest faces in the mid-facial region. The Australian and the Melanesian samples exhibit, on average, a high value of the zygomaxillary index, followed by the samples from the western hemisphere of the Old World.”(1)
Comment
Population variation in the side view of the skull is apparently too great for there to be any meaning to “ideal facial proportions” across populations. However, what is apparent is not necessarily a definitive conclusion, and more information is necessary to address this issue.
References
- Hanihara, T., Frontal and facial flatness of major human populations, Am J Phys Anthropol, 111, 105 (2000).
- Bastir, M., Rosas, A., and Kuroe, K., Petrosal orientation and mandibular ramus breadth: evidence for an integrated petroso-mandibular developmental unit, Am J Phys Anthropol, 123, 340 (2004).
- Mafi, P., Ghazisaeidi, M. R., and Mafi, A., Ideal soft tissue facial profile in Iranian females, J Craniofac Surg, 16, 508 (2005).
- Farkas, L. G., Katic, M. J., Forrest, C. R., Alt, K. W., Bagic, I., Baltadjiev, G., Cunha, E., Cvicelova, M., Davies, S., Erasmus, I., Gillett-Netting, R., Hajnis, K., Kemkes-Grottenthaler, A., Khomyakova, I., Kumi, A., Kgamphe, J. S., Kayo-daigo, N., Le, T., Malinowski, A., Negasheva, M., Manolis, S., Ogeturk, M., Parvizrad, R., Rosing, F., Sahu, P., Sforza, C., Sivkov, S., Sultanova, N., Tomazo-Ravnik, T., Toth, G., Uzun, A., and Yahia, E., International anthropometric study of facial morphology in various ethnic groups/races, J Craniofac Surg, 16, 615 (2005).