Here is a novel approach to generating more attractive faces using a computer, though the morphing methodology used leaves much to be desired. The article is by Wong et al.(1, pdf)
The genetic algorithm used
Take a sample of faces and have them rated for attractiveness by judges on a 1 – 10 scale. Then each of these faces is randomly assigned a number between the minimum attractiveness score and maximum attractiveness score. If a face has an attractiveness rating that is greater than the random number associated with it, it “breeds,” i.e., it is morphed with another randomly selected face that satisfies the same requirement to get a progeny (child). Using this approach, because of chance, it is possible that some very unattractive faces get to “breed” and very attractive faces do not get to “breed” but the bias is that more attractive faces are more successful at “breeding” or carrying over to the next generation.
The shortcoming of the study was using only 30 faces per generation. Small sample sizes can result in chance playing a greater role in determining who gets to “breed.”
Morphing
The morphing methodology or way to blend two faces did not adjust for face size or more precisely centroid size. The authors adjusted for face height and indicated that next time they would adjust for distance between the eyes, but as explained previously, neither method adjusts for face size (see how to adjust for face size).
The Parental sample
Each of the following faces is a blend of two faces having the same ethnic background. The reason that original faces were not used for the study is that the authors had many faces and could not obtain permission for using the photographs from each participant who was photographed.
The Parent faces.
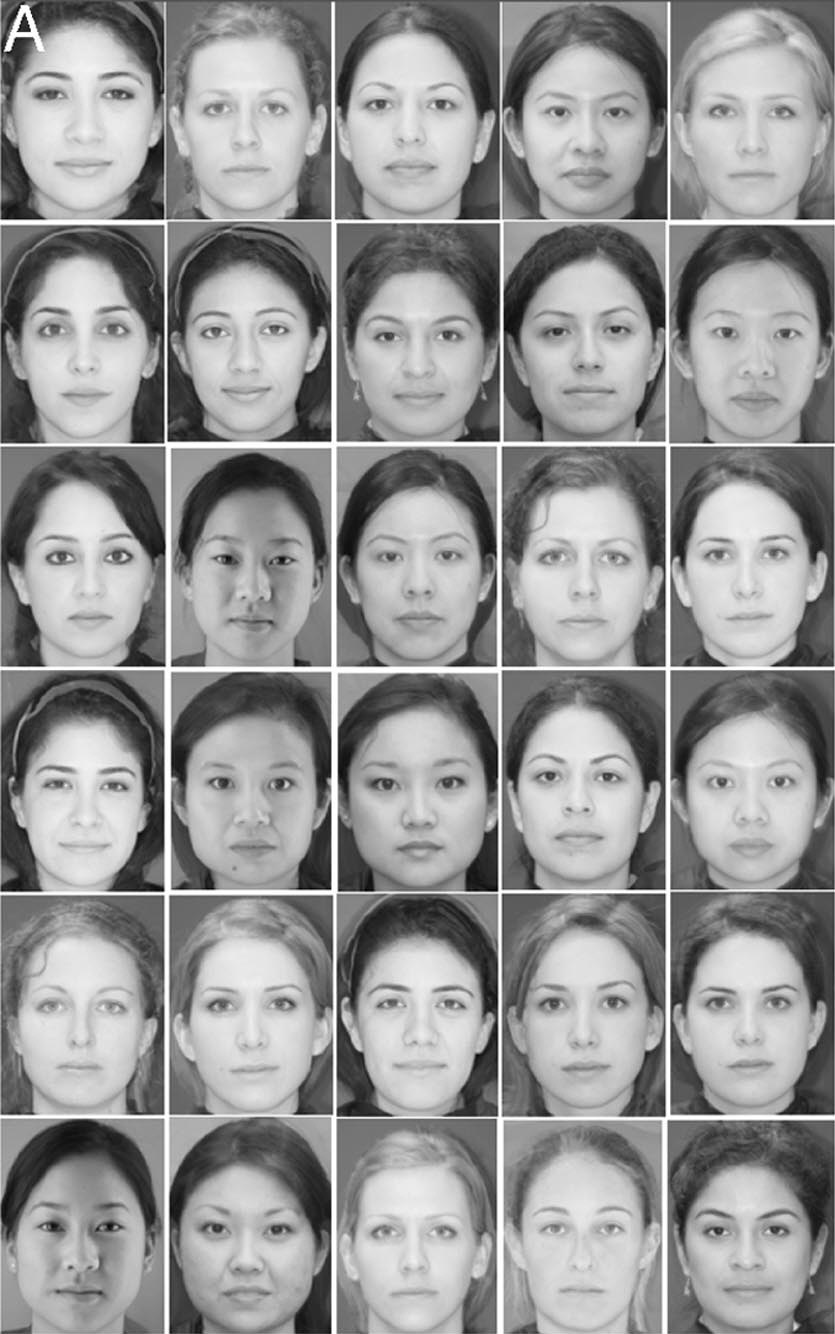
The faces are derived from whites, Latinas, East Asians and Middle Eastern individuals. The progeny generations were obtained by morphing without any regard for ethnic background, and the judges were ethically mixed, too. Hence the study is bound to provide some interesting results.
The most and least attractive faces in the parental and progeny generations
Most attractive (top row) and least attractive faces in parental generation (P), first generation of progeny (F1), second generation of progeny (F2), third generation of progeny (F3) and fourth generation of progeny (F4), respectively. The attractiveness ratings are listed at the bottom.
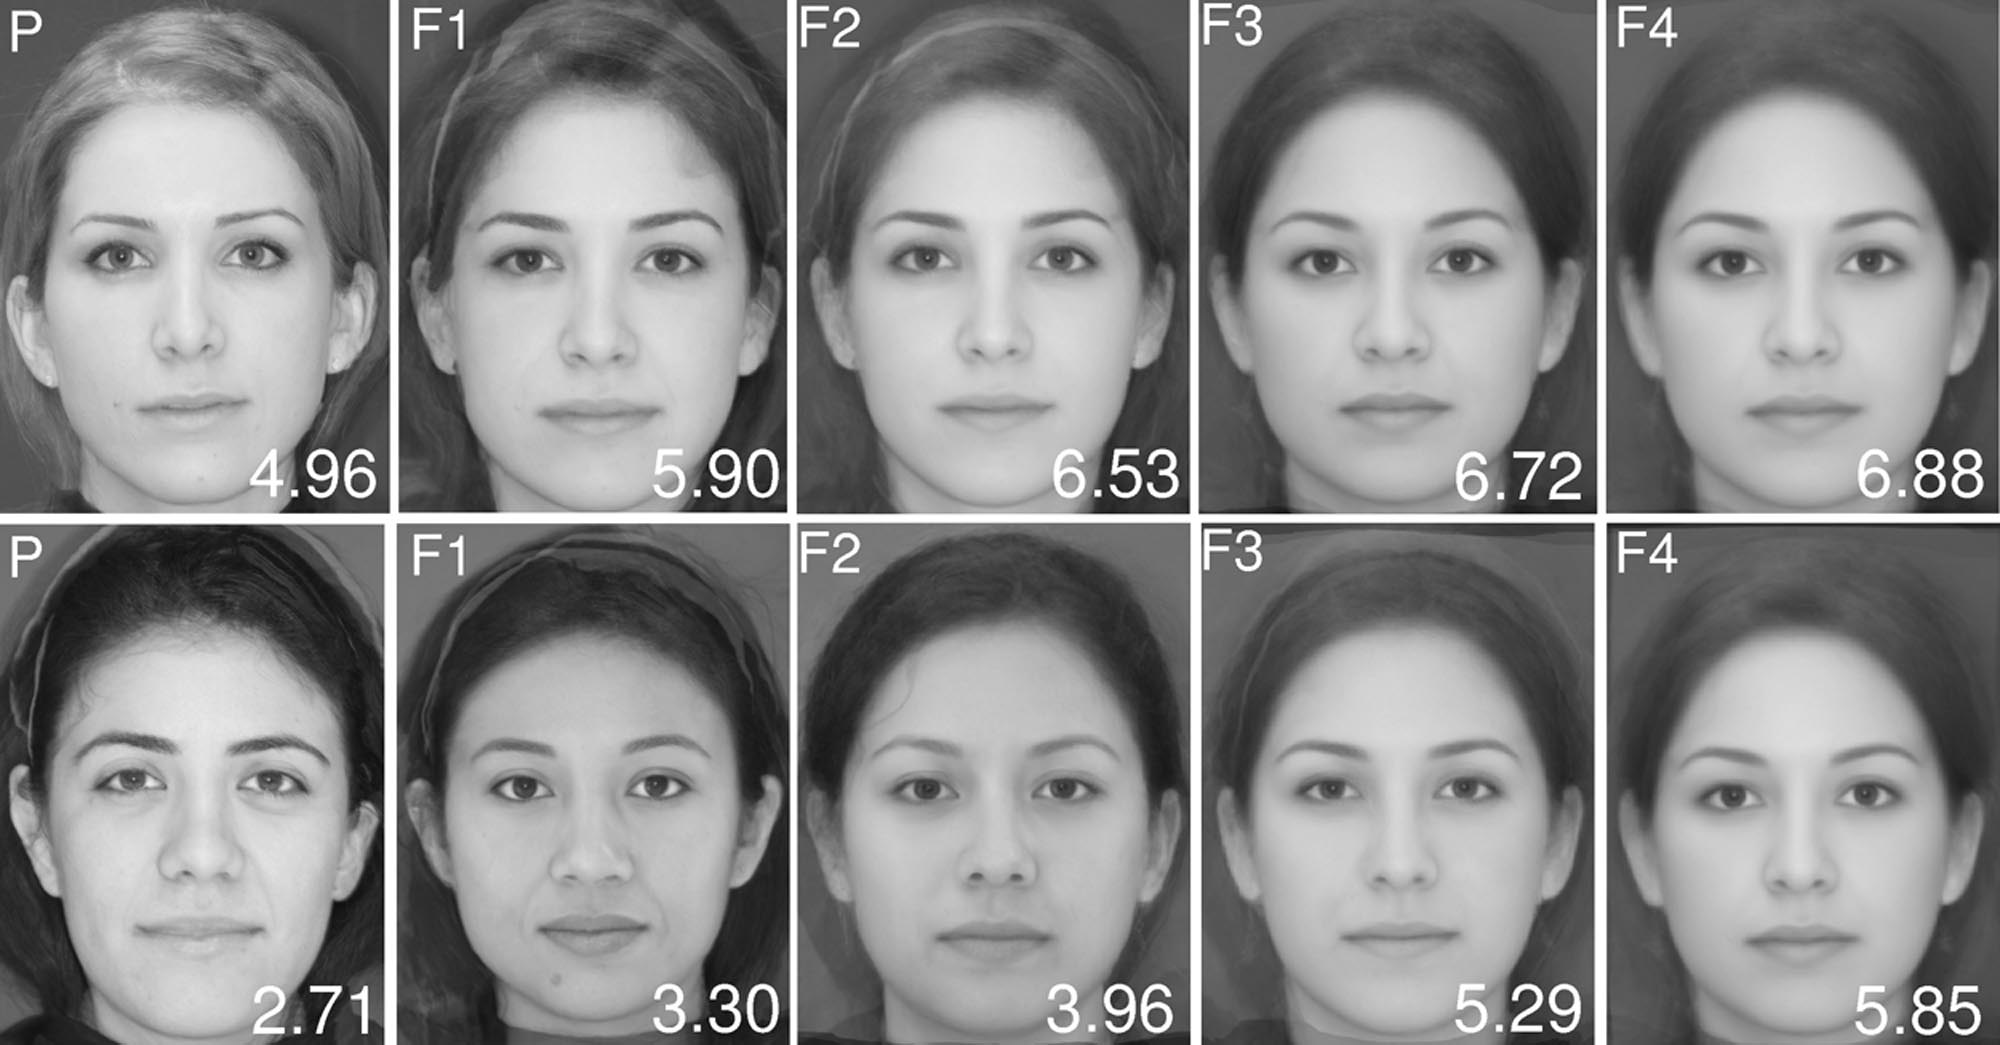
The most relevant finds are the elimination of 1) the more masculine faces, 2) the more-distant-from-white Latinas/their Middle Eastern counterparts and 3) stereotypical East Asians in the progeny (see the pdf for more pictures). In the first generation offspring, the most attractive face is predominantly European but with slight East Asian mixture. In the second generation, the most attractive face is European. In the third and fourth generations, the most attractive face for each generation is ethnically unclassifiable (e.g, European nose, East Asian width).
The third and fourth generation results are a little odd since it appears that the European element in the most attractive face has gone down though the most attractive face in the second generation would rank among the more attractive faces in the fourth generation. This could be an artifact of chance, as explained above, given the small sample size, but then it could also be argued that the results of the first two generations are artifacts of chance. However, take a look at all faces in the third and fourth generation:
Faces in the third (D) and fourth (E) generations.
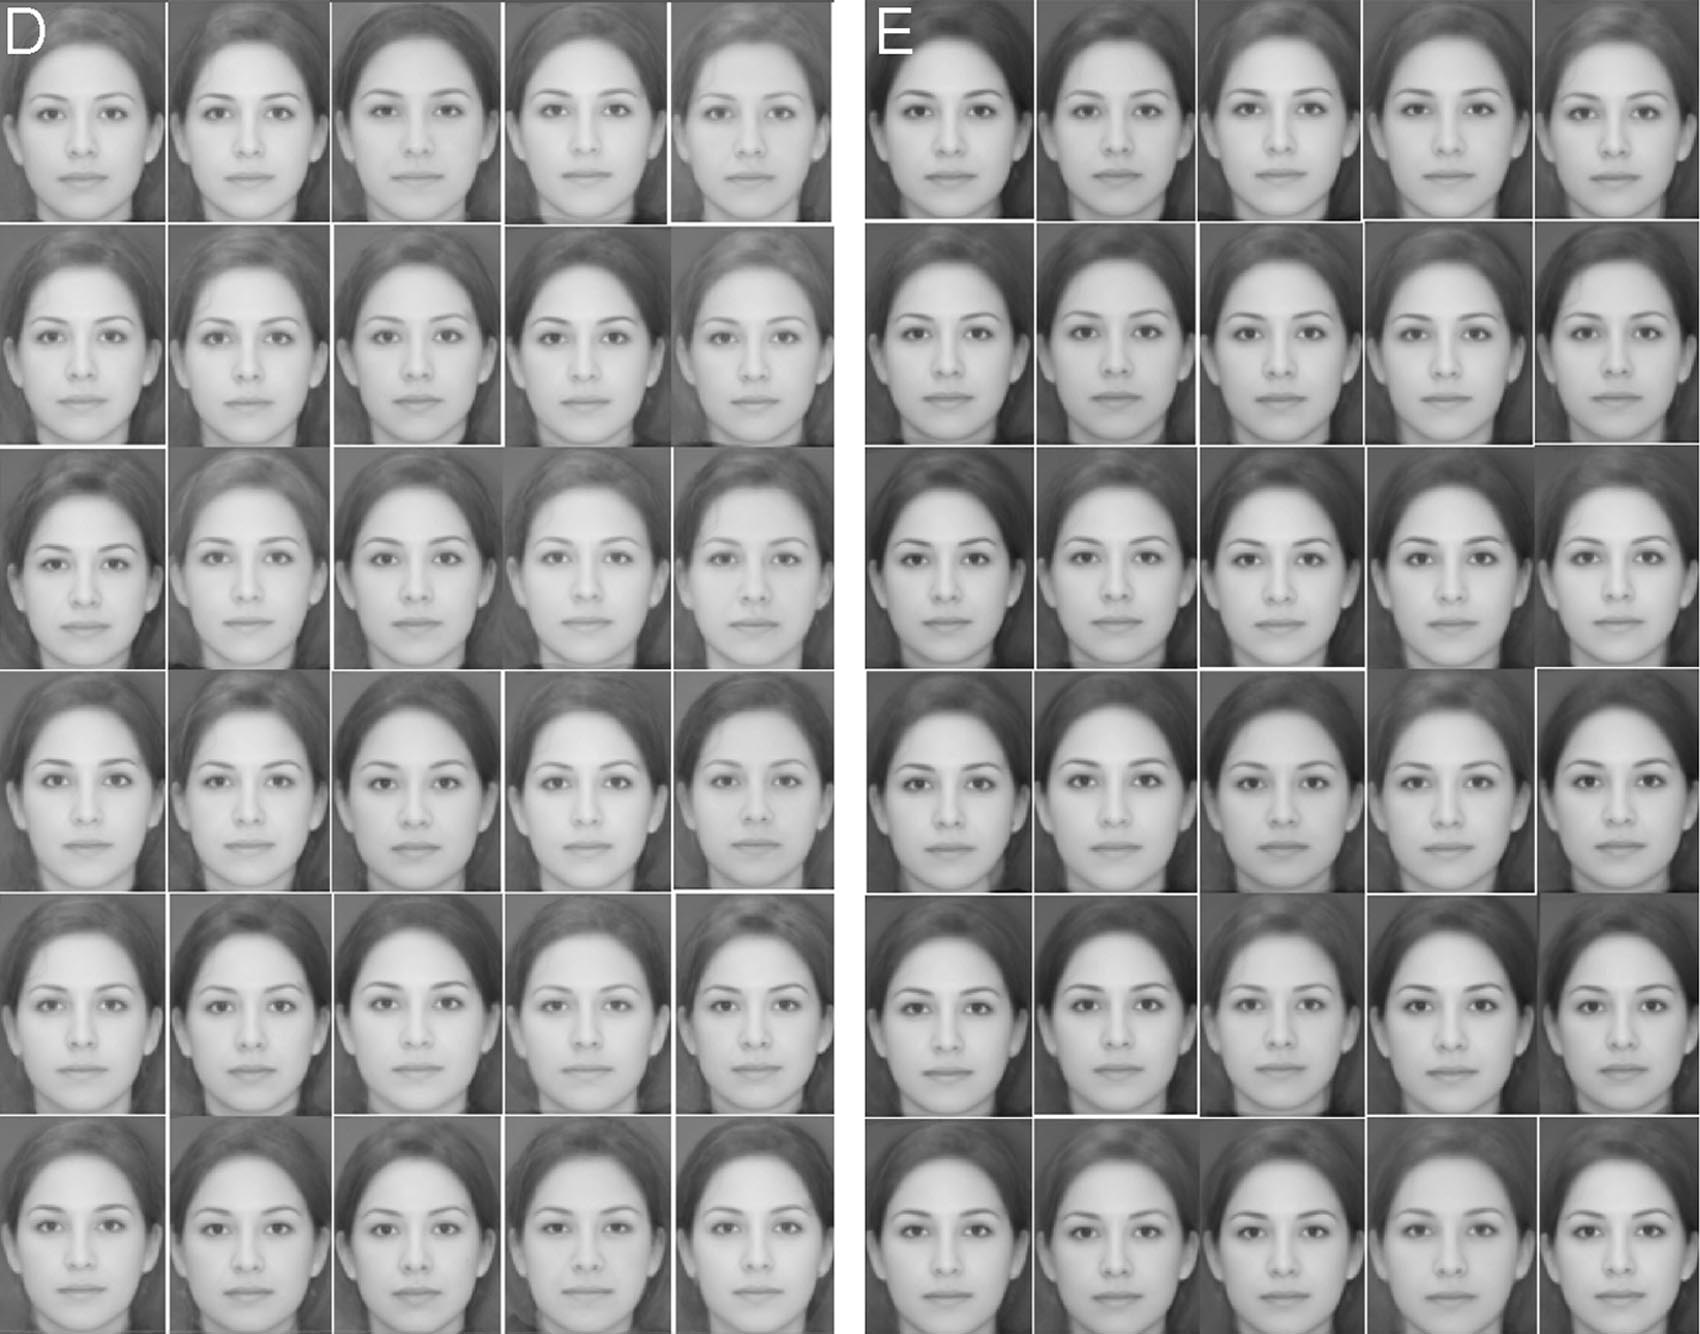
We note that the faces in the third and fourth generations generally lean toward Euro-Mediterranean norms. European faces are more overall derived and there is a preference for more derived faces. Therefore, the results of this study are broadly consistent with a preference for more feminine faces in women as well as a preference for more derived facial features.
Comments about the study
The morphing methodology is poor. Cosmetologists is spelled as cosmotologists. There is a mistake in the statement, “The multiple correlation coefficient for this model was 0.12, indicating that 12% of the variability in average facial attractiveness score was explained by the regression on these predictors.” It should be 1.4%, not 12%.
References
- Wong BJ, Karimi K, Devcic Z, McLaren CE, Chen WP. Evolving attractive faces using morphing technology and a genetic algorithm: a new approach to determining ideal facial aesthetics. Laryngoscope. Jun 2008;118(6):962-974.
Comments
Hi Erik,
I thought you might find this interesting: http://www.gnxp.com/blog/2007/04/intercourse-and-intelligence.php
I think there is a lot of stuff going on here, but I wonder if the 0% rate of Studio Art major virginity is anything to do with nonheterosexuality / developmental disturbance (especially if their intelligence is indeed lower) / prenatal testosterone.
Hi erik, I hate to not post directly on the subject but I just thought that this woman was really beautiful.
http://friedriceandbeans.typepad.com/photos/uncategorized/2007/09/08/meagangoodnipplesseethrough01.jpg
what do you think?
You are approaching eugenics now. Why don't you just publish Nazi ideology on what is racially 'pure' and be done with it?
How can you even countenance having a website that promotes 'feminine beauty' and then try and intellectualise whether someone is beautiful or not? Is beauty only in the eye the beholder, when the beholder is you, and the woman is some soft porn star with wonky teeth?
Also, when you use porn models to slate the 'serious' models of the fashion industry, you mention gay men having something to do with it....delicious irony then, that you repeatedly hold up porn models as your standard of femininity, when almost every porn site is riddled with anal sex.
So, your idea of femininity is imperfect women with questionable morals getting buggered by six Latino men and yet you come down like a ton of bricks and cry 'masculine' for any girl blessed with nice cheekbones and above average height?
You total care case. Seek help.
Richard: Don’t leave the same comment in different places. There is nothing related to eugenics here. The study addressed simulated a selection algorithm, and came up with two outcomes. One outcome, closely approximating natural elimination of the ancestral forms, has been a characteristic of the lineage leading to humanity throughout history. The other outcome, elimination of masculinized women, will not be seen because of a problem known as sexually antagonistic selection. There are no eugenics recommendations related to the study, and there couldn’t be since one outcome is not possible and the other outcome is naturally occurring.
There are plenty of studies cited within this site that address general preferences observed in the public. So don’t waste your time bringing in my own preferences.
Porn models tend to be masculinized women, are uncommonly examples of feminine beauty, and are a poor choice for assessing or illustrating what men optimally prefer in women. I have addressed this topic to some extent previously and have more coming up in a forthcoming publication in a peer-reviewed journal, which I will also reproduce here. So why am I using porn models? In short, the vast majority of the models I have used are not porn models. The use of nude models is explained by the need for scenarios where the woman needs to be minimally dressed, and also because there are few alternatives.
I have expressed nothing against tallness in women or ‘nice cheekbones.’ If ‘nice cheekbones’ happen to be masculinized, then calling them masculinized is not insulting them.
Ella Tse: The woman looks good to me.
Erik, you want women with feminine skulls?, well here is one you may not know:
1. Uldouz Gharehchaei - www.uldouz.com
Father: Yes, Uldouz is feminine and also attractive. I wasn't aware of her. Thanks.
Erik: Since there is increasing evidence to show that steroid hormones play a major role in beauty, to what extent would you say that high levels of Estradiol are responsible for creating a 'beautiful' feminine skull?
Especially considering that people like Uldouz and Shagheyegh probably owe their careers to Estradiol. Obviously many other proteins are involved, but without high levels of Estradiol, maybe they would be more average?
hey erik, what do you think about Sarah Palin's face. I think she is hot, and so do a lot of other men, but I can see her as kind of being a bit masculine? Am I right or wrong?
Father: There was a literature review about correlates of attractiveness that I addressed in an article titled “The importance of femininity to beauty in women.” The author found that femininity explained between 25% to 55% of the attractiveness of women’s faces. The average value was about 40%. So femininity is at best explaining half of the variation in women’s physical attractiveness, but usually will be explaining less than half of this variation. Since attractiveness is affected by many factors, the contribution of femininity by itself is impressive, but it does not mostly explain why a woman is attractive.
anyways: Sarah Palin is not bad looking in my opinion. She has robusticity in her face, especially the jaw, but it isn’t exactly masculine. She looks good to me from several angles, not so good from other angles, but never a plain or unattractive woman. When I first found out about her – her first public speech – my reaction was I want to see her as President and my friend’s wish was that he would like to see her naked.
Erik: Have you come across the research paper entitled: 'Mate choice decisions: the role of facial beauty' by V.S. Johnston? It also advocates that pre-natal steroid exposure plays at least some role in facial beauty. Otherwise there is actually very knowledge of the biology behind beauty, probably one the most understudied areas in biology.
Erik: I bet you would find that people like Shagheyegh and Uldouz have high 2D:4D ratios. This would indicate high pre-natal estradiol. Although as you stated earlier that estradiol doesn't have that much of an effect by itself, not being exposed to too many androgens may also play a role, as too many androgens would seriously cause a womans face to appear 'plain' by protruding the glabella and elonagting the chin.
Also, from this it is clear that the genes that produce an attractive face phenotype, are the same for both male and female, with the androgens and estrogens determining wether they are male or female.
Very interesting article.