To make the case that some correlates of beauty are objective, ideally one should show universal agreement and provide evidence that these correlates have some biological significance other than merely helping attract more potential mates and/or show that these correlates are sufficiently abstract in order to render implausible the notion that universal or broad agreement as to what constitutes beauty does not merely reflect social conditioning.
On the other hand, universal agreement is not possible because some people have defective eyesight/vision and/or a variety of brain abnormalities. Therefore, one has to focus on the central tendency of aesthetic preferences, i.e., broad agreement, in a population in order to assess objective correlates of beauty, a number of which have been well-documented in the literature: averageness, low overall fluctuating asymmetry and the extent of femininity (see the basic aesthetics overview). Of course, there are individual preferences, but these do not undermine broad agreement as to what constitutes beauty.
Fluctuating asymmetry
Fluctuating asymmetry is the random component of bilateral asymmetry, and low values of this variable imply greater developmental stability. Fluctuating asymmetry is a within-individual measure and is not relevant to a comparison of beauty across populations. A preference for low overall fluctuating asymmetry should not be confounded with a preference for greater symmetry since there are non-random components of asymmetry that result from design. Thus, keeping the non-random component of asymmetry constant, people with lower overall fluctuating asymmetry will be more symmetrical, but the aesthetic preference here is not one of greater symmetry but one of reduced overall fluctuating asymmetry. This correlate of beauty is sufficiently abstract so as to not be readily ascribed to social conditioning.
Averageness
Averageness of facial features, referring to having population-typical features on all counts, bounds correlates of physical attractiveness that correspond to deviation from the average (e.g., somewhat greater femininity than average being a strong correlate of beauty in women). Whereas averageness is a correlate of beauty within populations, is it a correlate of beauty at the level of the species?
This question can be answered by considering whether the offspring of individuals from separate continental populations manifest features in between their parents. Martinez-Abadias et al. addressed this issue for craniofacial shape involving White Spaniards, Native Americans and their mixed offspring.(1) The Spaniard skulls (SA) were from 19th century Madrid, the Native American (AA) skulls were from the late postclassical pre-European-contact period, and the mixed offspring skulls were from the 17th century (SMT) and 19th century (HSJ). The AA, SMT and HSJ samples were from the Central Valley of Mexico.
The craniofacial landmarks assessed are shown in Fig 1a and described in Table 1.
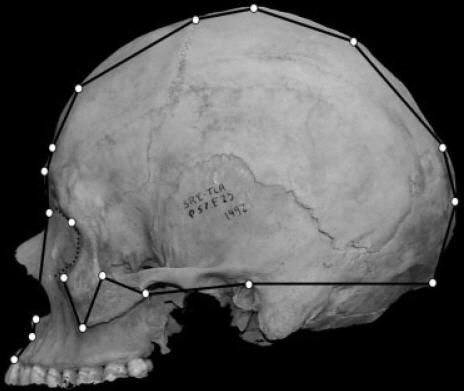
Fig 1a. Landmarks evaluated.(1)
| Table 1. Landmarks in Fig 1a defined.(1) |
 |
Canonical variates analysis of the shape variables resulted in three canonical roots that are graphically depicted in Fig 1b.
Fig 1b. Plots of the three canonical roots (variance explained in brackets). SA, open squares; AA, open circles; SMT, solid diamonds; HSJ, solid triangles. Ellipses account for 95% of within-group variation.(1)
The first canonical root separated the ancestral populations (SA and AA) and showed the mixed populations to lie in between the ancestral groups; the second canonical root moved the mixed populations away from an intermediate positioning between the ancestral groups; the third canonical root somewhat separated the two mixed populations, with the earlier sample (SMT) being closer to Native Americans and the later sample (HSJ) in between the two ancestral groups.
Fig 1c highlights major shape changes between the 4 groups.
Fig 1c. “Euclidean Distance Matrix Analysis mean shape comparisons, highlighting major shape changes. a: AA-SA. b: SMT-AA. c: SMT-SA. d: HSJ-AA. e: SA-HSJ. f: SMT-HSJ. Solid and dashed lines, respectively, indicate scaled linear distances 10% longer or shorter in reference shape (first) than in target shape (second). Black thick lines indicate those distances that fit the expected morphological pattern, whereas grey thin lines indicate those distances that are considered deviations from the quantitative genetics expectations.”(1)
It is seen that mixed offspring manifest a number of deviations from the expected average, i.e., shape in between white Spaniards and Native Americans, and this is most evident in the face and for moderate shape differences (< 10%) between the two ancestral groups (Fig 1d).
Of the 52 distances between the landmarks in Fig 1a, only 48% fit the expected pattern -- i.e., shape in between the ancestral groups -- in the mixed offspring; 21.1% fit in HSJ but not in SMT, 1.9% fit in SMT but not in HSJ, and 28.8% did not fit the expected pattern in either SMT or HSJ groups. “Thus, the high "predictor efficiency"’ of major shape changes diminishes from 87.5% to 48% when moderate shape changes are considered.”(1) Over half the interlandmark distances that fit the expected pattern corresponded to neural structures.
Fig 1d. “a: Range scatterplot of elements of shape difference matrix, representing moderate shape changes between ancestor series. H0, expected pattern observed; H1, expected pattern not observed. b: Percentages of fitted observations in major and moderate shape changes. Left column shows percentages of distances that fit quantitative genetics prediction, whereas right column shows percentages that did not. Each column is subdivided in percentages of distances measuring structures derived from neural growth pattern (dashed region), from somatic growth pattern (vertical lines), and comprising both structures (horizontal lines).”(1) See Table 1 for landmark abbreviations.
Therefore, the concept of average facial features does not apply between Native Americans and Europeans. Now, geography-based sampling of neutral DNA markers from around the world -- though not all populations -- reveals 6 population clusters historically distributed across different continents: European, sub-Saharan African, Mainland East Asian, New Guinean-Australo-Melanesian, North American Indian and South American Indian.(2) Combining the American Indian groups into a single group gives us 5 population clusters that are notably different in craniofacial features, and these 5 population clusters should be considered as the minimum number of population clusters such that the notion of average facial features does not apply between any two of these clusters. A series of 24 largely selection-neutral craniofacial measurements revealed 8 population clusters: European, sub-Saharan African, Mainland East Asian, New Guinean-Australo-Melanesian, American Indian, South Asian Indian, Eskimo-Siberian and a Jomon-Pacific group.(3) It is safe to assume that the notion of average facial features does not apply between any two of the 8 clusters identified by largely neutral craniofacial measurements.
Feminization
The degree of feminine appearance of women, not to be confused with actual femininity, varies across populations. Somewhat above average feminine looks and averageness of features are both correlates of beauty in women. Thus, the aesthetically pleasing range would be a narrow range toward the right [more feminine looking] of average, as in a generic example illustrated by considering the simotic index in Europeans (Fig 4 on the page addressing the front of the face), and the narrowness here reflects the upper limit of deviation from the average that corresponds to a magnitude that is not so great as to violate the averageness correlate of beauty. Thus, specifying a somewhat above average level of feminine looks in the most overall feminine-looking female population as a reference standard for beauty would correspond to greater deviation from the average of populations other than the reference population, i.e., a violation of the averageness correlate of beauty in a number of populations, and thus this reference standard cannot be considered an objective criterion for comparing beauty across populations. Similarly, a hypothetical species average of feminine appearance in women cannot be specified as an objective reference standard because average physical appearance across populations is not meaningful and this reference standard would be in the masculine-looking range of the most overall feminine-looking female populations.
The components of feminine appearance in women include actual femininity (e.g., profile of sex hormones and steroid receptors), ethnicity-specific traits unrelated to sex hormones and steroid receptors, and the extent of fineness of facial features, whereby finer facial features add pseudo-femininity to the face. It is easily seen that what is true of overall feminine appearance with respect to an objective comparison across populations is also true of all three components of overall feminine appearance.
A population-typical preference for women with above average feminine looks would be a prime candidate for social conditioning related to the internalization of heteropatriarchal norms. However, somewhat above average feminization in women corresponds to greater fecundity and fertility (evidence: 1, 2), and thereby the aforementioned preference appears to be related to biological design.
Pedomorphy as a potential correlate of beauty
A potential correlate of beauty is pedomorphy, which is the retention in adults of child-like traits. For instance, women have facial features that are closer to those of children than men, and more feminine women have facial features that are even closer to those of children. Thus, it may be proposed that pedomorphy is a correlate of beauty. Pedomorphy may be specified in two contexts shown in Figures 2a-b; see legends for details.
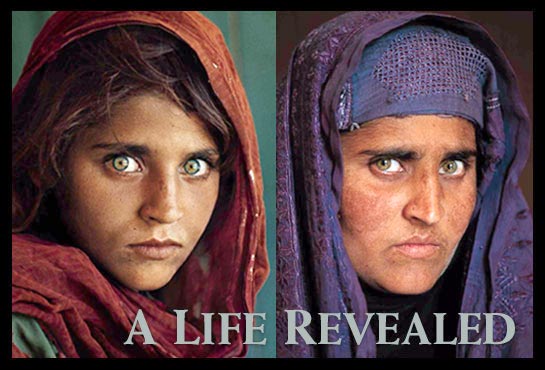
Fig 2a. The woman featured is an Afghan woman, Sharbat Gula. Her classic National Geographic photo at age 13 is closer to the adult face structure of Northern Europeans with respect to gracilization than her adult features are, and additional similar examples from the Middle East and geographically adjacent populations in Southern Europe and West Asia could be used to argue that Northern Europeans are more pedomorphic.

Fig 2b. The woman featured is a Japanese glamour model, Aki Katase, from Graphis (adult site). The greater mid-facial flattening of Northeastern Asians could be seen as more pedomorphic, and in the case of the woman shown, her more gracile than average jaw structure certainly helps make her facial features look closer to those of children than those of the average Japanese woman.
The validity of pedomorphy as a correlate of beauty needs to be seen in light of neoteny, which refers to the retention in adults of some characteristics of the children of the ancestral species. Thus, it has been proposed that since the skull of chimpanzee infants is closer to the skull of adult humans than the skull of adult chimpanzees is, adult human skulls are neotenized chimpanzee skulls (Fig 2c). This issue has been investigated, and is addressed below.
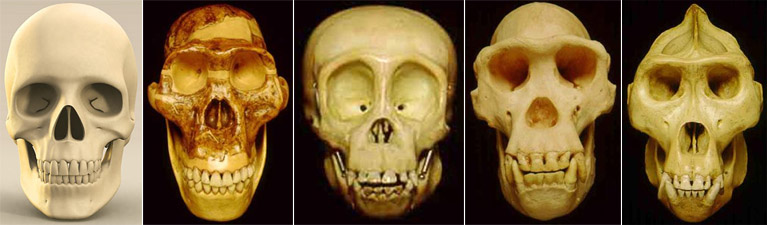
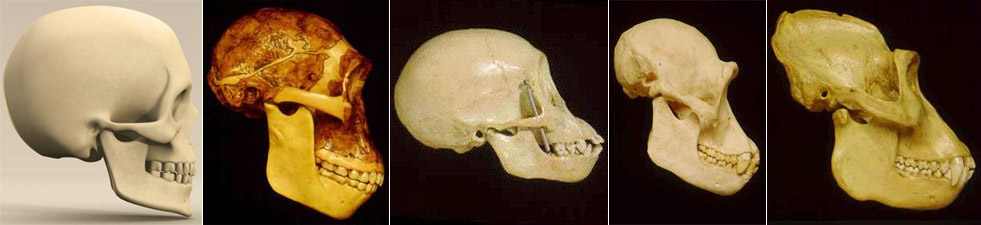
Fig 2c. From left: adult European (Homo sapiens), adult ape-man (Australopithecus africanus), juvenile chimpanzee (Pan troglodytes), adult chimpanzee (Pan troglodytes), adult gorilla (Gorilla gorilla); click the images for larger versions. The skull of a gorilla looks like the skull of an overgrown chimpanzee, and the skull of a juvenile chimpanzee is closer to the skull of an adult human than the skull of an adult chimpanzee is. It could be proposed that the lineage from ape through ape-man to humans has been characterized by growth retardation whereby the skull of the adult ends up stuck in a juvenile form of the ancestral species.(4)
Penin et al. examined 41 human (British) skulls (18 adults, 23 children) and 50 common chimpanzee skulls (17 adults, 33 juveniles).(5) The outline of the human-chimpanzee average craniofacial features is shown in Fig 2d, and the landmarks are identified in Table 2.
Fig 2d. Top: right side of the skull shape in between (average) chimpanzees and humans. Bottom: Inferior view (from below) of the right side of this skull. The links between the 29 landmarks are drawn to make anatomical structures clear. “Landmarks 7-26-8-9-27-10: Outline of cranial vault. Landmarks 14-16-15-17: Orbital cavity. Landmarks 3-29-4-18-19-20: palate. Landmarks 21-22-23: Glenoid fossa. Landmarks 28-11-12-13: Mastoid and zygomatic arch. Landmarks 1-2-24: Sphenoid clivus. The foramen magnum is located between landmarks 1–10, and the nasal aperture between landmarks 5–6.”(5)
| Table 2. Landmarks in Fig 2c defined.(5) |
 |
| 1Classical anatomical landmarks defined in: "Aiello L and Dean C (1990, p. 50–53). An introduction to human evolutionary anatomy. London, San Diego, New York, Boston, Sydney, Tokyo, and Toronto: Academic Press, Harcourt Brace and Co." |
The human (H) and chimpanzee (P) skulls were classified into 4 groups, based on the dental stage: no permanent molar erupted (stage 0), first permanent molar erupted (stage 1), second permanent molar also erupted (stage 2) and all permanent molars erupted (stage 3).
The shape differences between humans and chimpanzees across development can be divided into two components: common allometry, which describes shape change as a function of increasing size, and is common to both species (Fig 2e), and a discrimination component, which distinguishes humans from chimpanzees (Fig 2f).
Fig 2e. "Common allometry in humans and chimpanzees. The two designs represent size-related shape changes in a chimpanzee- human consensus. Dashed lines, juvenile specimens (no permanent molar); solid lines, adult specimens; dotted lines, plane of the foramen magnum (landmarks 1–10). Top: Sagittal view. Bottom: Inferior view. Faces of skulls are turned to right. The most important change in shape during growth concerns the relative volume of the neurocranium, which becomes proportionally smaller relative to the face. The plane of the foramen magnum becomes less obliquely oriented. Angle alpha measures the part of the change in the orientation of the foramen magnum related to the common allometry."(5)
Fig 2f. “Discriminant shape changes. Dashed lines, chimpanzees (all ontogenetic stages confounded); solid lines, humans (all ontogenetic stages confounded); dotted lines, plane of the foramen magnum (landmarks 1–10). Top: Sagittal view. Bottom: Inferior view. Faces of skulls are turned to right. The shape traits that discriminate humans from chimpanzees involve remodeling of the shape of the skull and face, which is clearly different from ontogenetic changes given in Figure 2e. Angle beta measures the part of the change in the orientation of the foramen magnum unrelated to the common allometry, which discriminates humans from chimpanzees independent of growth.”(5)
A plot of the common allometry factor against the discriminant factor is shown in Fig 2g. It can be seen that neoteny applies to craniofacial size but not craniofacial shape in humans. Given that humans have regressed jaws as a result of both the discrimination factor and retarded growth related to the common allometry factor, this regression is only partly neotenous.
Fig 2g. Allometry vs. discriminant shape changes. "Stages of growth: 0 (no permanent molar); 1 (first permanent molar); 2 (second permanent molar); and 3 (third permanent molar). H0–H3: Homo sapiens. P0–P3: Pan troglodytes. Common allometry: common shape allometric vector. Discrimination: discriminant vector. Two clouds corresponding to humans and chimpanzees are perpendicular to the discriminant vector (y-axis) and parallel to the common allometric vector (x-axis), showing independence of the two processes."(5)
Thus, one has to seek alternative explanations of what appear to be pedomorphic correlates of beauty. Thus, for instance, the difference between the Afghan woman shown in Fig 2a and more generally the Mediterranean people (Southern Europeans and Middle Easterners) on the one hand and Northern Europeans on the other hand is one of greater gracilization and finer facial features in Northern Europeans, as discussed previously, rather than one of more extensive neotenization, i.e., greater pedomorphy, in Northern Europeans. Indeed, for instance, the nasal bones are more prominent in Northern Europeans than in Mediterranean populations (page 2), which cannot be called pedomorphic.
The mid-facial flattening seen in the Japanese woman in Fig 2b, making the Japanese woman look more child-like, is a different matter. Hanihara computed canonical correlations between indices of facial flatness in the sagittal plane (forehead flatness, depth of infraglabellar notch, jaw protrusion) and indices of facial flatness in the transverse plane (flatness of nasal bones, fronto-orbital flatness, mid-facial flatness) across human populations; see data in this pdf file. These indices were positively correlated. It turns out that anatomically modern humans in the late Pleistocene (126,000 to 12,000 years before present) had [in the sagittal plane] flat foreheads, deep infraglabellar notches and notably protruding jaws, and also manifested a more or less transversly flat mid-face.(6-8) Thus, present Australian aborigines match anatomically modern humans in the late Pleistocene with respect to having [in the sagittal plane] flat foreheads, deep infraglabellar notches and notably protruding jaws; present Northeastern Asians match anatomically modern humans in the late Pleistocene with respect to mid-facial flatness in the transverse plane, and although they have protruding jaws compared to Europeans, their jaw protrusion is nothing on the order of what is seen in sub-Saharan Africa and among Australo-Melanesians; and several present sub-Saharan African populations are overall most similar to anatomically modern humans in the late Pleistocene on all counts of facial flatness except for having a deep infraglabellar notch, which can be assumed to have been gracilized in sub-Saharan Africans. Therefore, assuming that the mid-facial flatness of Northeastern Asians reflects differential retention of an ancestral or generalized trait, then it cannot be considered pedomorphic, but it is difficult to conclude that the mid-facial flatness of Northeastern Asians reflects differential retention of an ancestral trait because of the positive correlations obtained between the indices of facial flatness in the sagittal and transverse planes, and the placement of Northeastern Asians toward the derived end of the scale with respect to measures of facial flatness in the sagittal plane. There is no reason to believe that greater than average flattening of the mid-face is preferred to lesser than average flattening of the mid-face by Northeastern Asians, but the reverse appears to be true as discussed shortly. Hence, it cannot be assumed that the mid-facial flatness of Northeastern Asians is a result of sexual selection allegedly driven by a preference for pedomorphy.
It should also be noted that normal developmental processes are expected to orient a person toward sexually mature individuals rather than sexually immature individuals. Therefore, pedomorphy is not a correlate of beauty, and more attractive features that appear to be pedomorphic are either somewhat more feminine than average features (e.g., less prominent noses and broader faces, controlling for other factors) and thereby more attractive in women or somewhat more gracile than average features and thereby more attractive in both men and women.
Europeanization as an apparent correlate of beauty
In a comparison of the facial features of North American white women and Korean-American women (some details already discussed), Choe et al. had the Korean-American women rated for attractiveness by Korean-Americans/Koreans, and compared the average North American white woman with the attractive Korean-American woman (90th percentile of attractiveness) and the average Korean-American woman.(9) Figures 3a-c show that the facial features of the attractive Korean-American woman were shifted toward the average North American white female norms, and the details are provided in Table 3a.
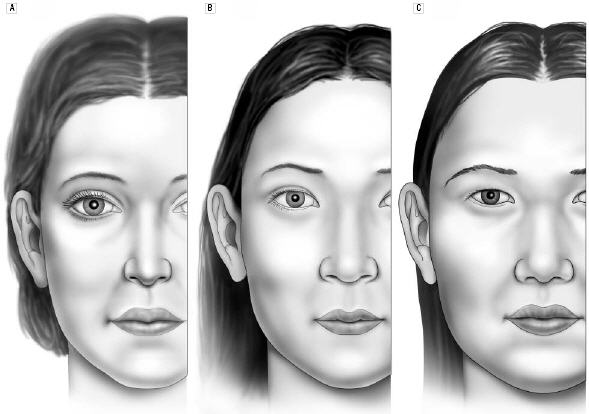
Fig 3a. The front views of the average North American white woman (A), the attractive Korean-American woman (B) and the average Korean-American woman (C).(9)
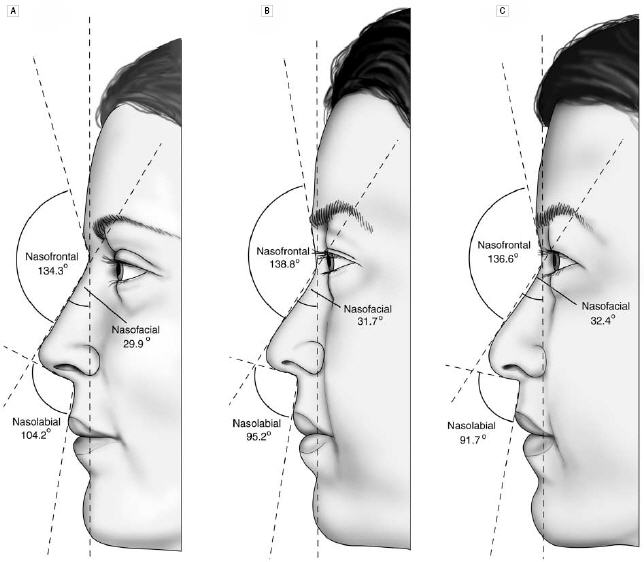
Fig 3b. The side views of the average North American white woman (A), the attractive Korean-American woman (B) and the average Korean-American woman (C).(9)
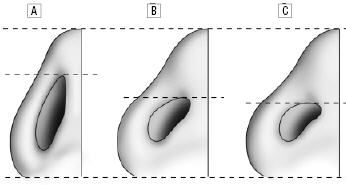
Fig 3c. The basal views of the average North American white woman (A), the attractive Korean-American woman (B) and the average Korean-American woman (C).(9)
| Table 3a. Comparison of average anthropometric facial measurements in North American white women and Korean-American women in two attractiveness groups.(9)* |
 |
Abbreviations: ac, alar curvature point; al, alare; al_, alar rim; c, highest point of the columella; ch, cheillion; en, endocanthion; ex, exocanthion; g, glabella; gn, gnathion; mf, maxillofrontale; n, nasion; prn, pronasale; sa, superaurale; sba, subaurale; sn, subnasale; tr, trichion; v, vertex; zy, zygion. *Unless otherwise indicated, data are mean (SD) measurements in millimeters. †P values were based on unpaired t test with the Welch correction (the approximate t statistic). |
Some facial measurements were more relevant to attractiveness scores in Korean-American women than others (Table 3b). Table 3c shows the facial measurements most relevant to attractiveness scores, whereby the 9 variables accounted for 46% of the variance in aesthetic score; these variables cluster in the mid-face region: face width, nose length, nose width, craniofacial haft width, eye width, mouth width, ear length, projection of the nasal bones and nose tip, and forehead height.
| Table 3b. Correlations between anthropometric measurements and aesthetic scores in Korean-American women.(9) |
 |
Abbreviations: ac, alar curvature point; al, alare; al_, alar rim; c, highest point of the columella; ch, cheillion; en, endocanthion; ex, exocanthion; g, glabella; gn, gnathion; mf, maxillofrontale; n, nasion; prn, pronasale; r p, Pearson correlation coefficient; sa, superaurale; sba, subaurale; sn, subnasale; tr, trichion; v, vertex; zy, zygion. *Statistically significant difference. |
| Table 3c. Regression coefficients, standard error, and uniqueness indices of 9 aesthetic facial measurements obtained in the final multiple regression model predicting total scoring.(9) |
 |
Abbreviations: ac, alar curvature point; al, alare; ch, cheillion; en, endocanthion; ex, exocanthion; g, glabella; gn, gnathion; n, nasion; prn, pronasale; sa, superaurale; sba, subaurale; zy, zygion. *Uniqueness indices indicate the percentage of variance in total scoring accounted for by a given independent variable beyond the variance accounted for by the other 8 independent variables. F tests indicate the significance of the uniqueness indices; degrees of freedom equal to 1 and 62. |
The shift toward European norms when one moves from the average Korean woman to the attractive Korean woman is not limited to just Korean women. This is generally true of both non-European and European populations (e.g., Figures 4a-h). Thus, whereas one would expect people of European ancestry to assign higher attractiveness ratings to non-European faces that are closer to European norms than average, this is also true of non-Europeans in general, and Choe et al.(9) have documented this formally for an Asian population.
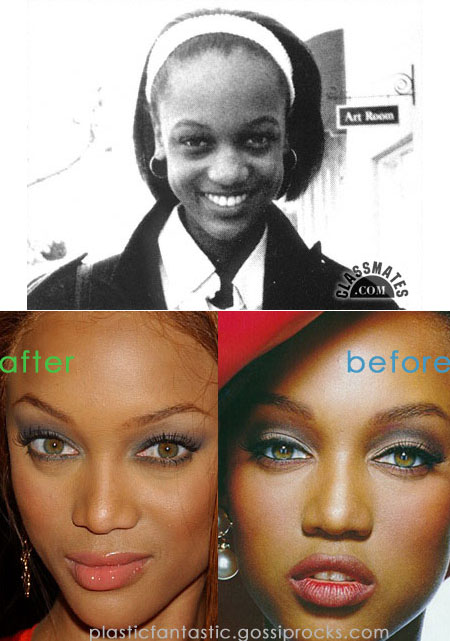
Fig 4a. African-American supermodel Tyra Banks has had at least two rhinoplasties (nose jobs). The African-American community appears to prefer the more artificial and thereby less-African-looking Tyra Banks to the original and more-African-looking Tyra Banks.

Fig 4b. Yet another example of Tyra Banks making herself more attractive to the African-American community by making herself look less African.
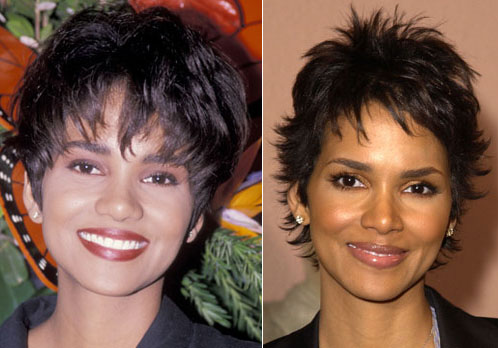
Fig 4c. Top-ranked American actress Halle Berry. Halle Berry has undoubtedly improved her appeal to the African-American community by making her nose look less African.
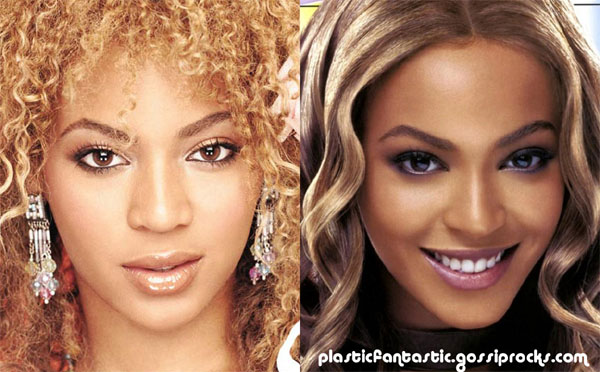
Fig 4d. A nose job is much superior to hair dye when it comes to looking less African; woman shown: Beyonce Knowles.

Fig 4e. African-American Beyonce Knowles probably looks better to African-Americans in the photo on the right than in her more African-looking picture on the left.
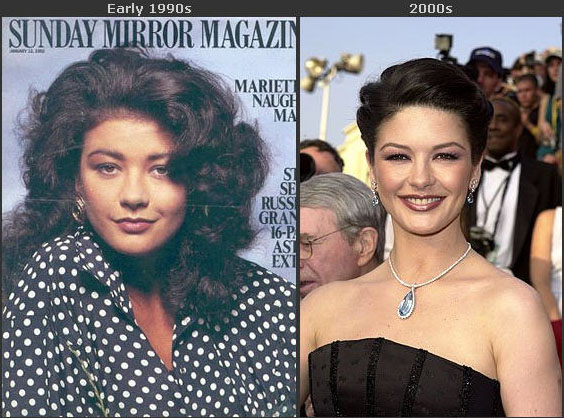
Fig 4f. Welsh actress Catherine Zeta Jones went from having heavy ethnic features -- looking like a South American Hispanic to be more precise -- to looking European, which has undoubtedly helped her popularity among Europeans and even placed her among top-ranked sexy/beautiful women!

Fig 4g. Jyoti Brahmin, who represented India in the 2004 Miss Earth beauty pageant, has fewer ethnic features than the average Hindu, and this is generally true of Hindus considered to be attractive by Hindus at-large.

Fig 4h. The cosmetic surgery-induced transformation of Julie Chen corresponds to both increased attractiveness and de-Asianization.
There are several possible explanations for why non-European faces that are somewhat shifted toward European norms are considered more attractive than average by non-Europeans in general. The most obvious explanation is that Western culture has a much stronger global impact than other cultures, and this has lead to non-Europeans internalizing Western norms. However, this has not been proven. Humans cannot be manipulated any way one pleases. For instance, in spite of skinny and masculine high-fashion models occupying the highest status among female models in the West, and the most sexy Western female models -- in terms of prominence and impact factor -- being typically notably masculinized, only a minority of Western women are influenced by the skinniness of high-fashion models, Western people overwhelmingly find the typical skinniness of high-fashion models socially unacceptable, and they assign higher attractiveness ratings to women with more feminine than average looks. Therefore, alternative explanations should be considered.
One possibility is that ancestral humans shared a common aesthetic sense, which controlling for natural and sexual selection, as well as random genetic drift, would result in a similar transformation of the face across populations, which would specifically lean toward modern European norms, but the combination of natural and sexual selection has not been constant for all populations, which in turn accounts for why non-Europeans find co-ethnics with faces shifted toward European norms more aesthetically pleasing, and why this is especially true after exposure to Europeans, whereby non-Europeans recognize people with several -- though not all -- facial features consistent with their latent aesthetic preferences.
This possibility needs to be addressed in some detail. Since all human populations have a common ancestor, it is of course reasonable to assume a common origin of an aesthetic sense. The aesthetic sense centers around the population mean but shows some directional shifts, not deviating too greatly from the center of the population mean. For instance, one directional preference is above average feminine appearance in women. Another directional preference obviously lies along the ancestral-to-derived discriminant. Thus, starting from anatomically modern humans in the late Pleistocene, some ancestral-to-contemporary changes involve (the directionality in parentheses): face size and bone structure (reduced face size and gracilization, i.e., a finer bone structure), forehead shape in sagittal plane (from a flat profile to a more rounded profile), depth of infraglabellar notch (from deep to shallow), nasal bones (from a flattened profile to a more projecting profile), mid-facial region or zygomaxillary index (from a flattened profile to a more projecting profile), and alveolar structure or mouth region (from protruding to regressed and flattened in profile view, i.e., sagittal plane).
With respect to the six aforementioned assessments, Northern Europeans deviate the most overall from the ancestral condition. However, the shallowest infraglabellar notches are found in some sub-Saharan African populations and the roundest foreheads in profile view are found in some Native American populations . Therefore, the ancestral-to-derived discriminant with respect to these six assessments is not synonymous with Europeanization, though it considerably overlaps with Europeanization.
Looking at the six assessments, several measures are related to mastication. Assuming a preference for finer facial features, a transition to cooking would relax selection pressures and lead to smaller and narrower faces, smaller teeth, less robust jaws and teeth, and smaller cheekbones -- some of these changes even occurring as secular changes(10, 11) -- as well as allow for the narrowing of the bottom of the craniofacial haft,(12) which may also correspond to proportionate narrowing of the rest of the craniofacial haft, which would altogether correspond to a shift toward modern Northern European norms on these measures. Indeed, it is well known that Europeans and the Ainu started cooking food much before other populations did.(13, 14) As far as the nasal bones are concerned, given their near-complete flatness in the great apes, a visually notable change in their extent of flatness can only be in the direction of more projecting nasals. Therefore, given similar sexual selection and relaxed selection pressures related to mastication, all human populations would be expected to shift toward the European average on several, though not all, measures related to the aforementioned six assessments.
It is also the case that a great deal of evidence points to stronger sexual selection in Northern Europeans than other populations in the recent past. Peter Frost has documented a lot of this evidence; specifically 1) the accumulation of an unusual amount of diversity at the MC1R locus in Europeans,(15) corresponding to the unusual diversity of hair color in Northern Europe, which has risen so rapidly that random genetic drift can be ruled out, and is also something that is not explicable in terms of natural selection; 2) the hostile environment of the Western part of the Eurasian tundra belt when humans migrated to this region, which skewed the sex ratio in favor of an excess of females, thereby allowing stronger sexual selection (also see this for more insights into the mechanism); and 3) Y-chromosome evidence for greater variability of reproductive success in European men compared to other men.(16) This evidence is consistent with the freer sexuality of the Norse and present Northern Europeans, and it has been pointed out that the greater tolerance of unusual sexual practices, especially non-conceptive sexual behaviors, among Northern Europeans is consistent with an inclination toward freer sexuality that would allow stronger sexual selection.(17) Therefore, it is a reasonable postulate that non-Europeans exposed to Europeans in general and Northern Europeans in particular will recognize several facial proportions in Europeans that are consistent with their latent aesthetic preferences lying along the ancestral-to-derived discriminant.
Hence, it should not be surprising that non-Europeans considered to have more-attractive-than-average faces by their co-ethnics have facial features that are somewhat shifted toward the more-overall-derived-than-average range, which also superficially appears to be a shift toward European norms given that Northern Europeans deviate the most overall from the ancestral condition, but this shift is not one of Europeanization, and this is even clearer when one considers additional features in Northern Europeans that are generally not appreciated by non-Europeans -- e.g., more body hair and thinner lips. Therefore, the extent of Europeanization is not a correlate of beauty that applies within populations other than European, but placement along the overall ancestral-to-derived discriminant is a correlate of beauty that applies within all populations though not between populations because this would violate the averageness correlate of beauty.
It should be noted that some features lying toward the derived extreme of the ancestral-to-derived discriminant are specialized features that characterize some populations but not others because of differential natural selection pressures, and thus there cannot be any objectiveness to designating one population average as more aesthetically appealing than another population average with respect to these specialized traits in so far as comparing the attractiveness of individuals across populations goes. Thus, there is nothing objectively better looking about curly Afro hair than the straight hair found in the Chinese or vice versa. Similarly, it is well known that increased usage of skeletal muscles increases the prevalence of Type I myosin (the principal motor protein found in slow-twitch fibers) and diminishes the prevalence of Type IIb myosin (the principal motor protein found in fast-twitch fibers).(18-21) Slow-twitch fibers being longer than fast-twitch fibers, a population that shifts toward more endurance work involving some skeletal muscles will gravitate toward a higher proportion of people with an increased baseline proportion of slow-twitch fibers and thereby a longer muscle belly for the skeletal muscles involved. Thus, if the increased endurance work involves more walking, then the shift, in humans, would correspond to longer calf muscles and more prominent soleus muscles, making the upper legs and lower legs look more proportionate in terms of girth, which is more characteristic of Europeans and Northeastern Asians than sub-Saharan Africans, but this does not imply that either extreme of these girth proportions is objectively more aesthetically appealing than the other for all human populations, though specific populations will have their own preferences.
It would be remarkable if the global impact of Western culture and the better quality of life in Western societies had nothing to do with many non-Europeans finding co-ethnics with faces somewhat shifted toward European norms as better looking, but it would be no less remarkable if this factor entirely accounted for this phenomenon. Read more on aesthetic preferences related to the ancestral-to-derived discriminant.
Other possible correlates of beauty
A brief perusal of several ratios suggested to describe aesthetically pleasing proportions shows that these ratios describe aesthetically pleasing proportions in Europeans, but have little to no relevance for other populations -- e.g., the neoclassical canons of facial beauty, aesthetically pleasing buttocks proportions, eyebrow aesthetics and Fig 5.
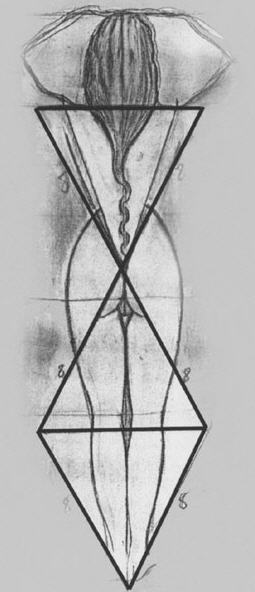
Fig 5. Body proportions in a woman based on three equilateral triangles circumscribing the dorsum and lower limbs.(22)
These proportions have been described by artists, anatomists/surgeons or cosmetologists of European extraction, and generally reflect descriptions of aesthetically pleasing proportions by individuals with sufficient intelligence to formalize what their brains have been shaped to find aesthetically pleasing, which will also be seen as aesthetically pleasing by others whose brains have been similarly shaped with respect to aesthetic appreciation -- Europeans in general. Given that crude indices cannot capture the subtlety of aesthetics, depending on the crudeness of aesthetic proportions such as the neoclassical canons, there will be an imperfect correlation between overall attractiveness and compliance with crude aesthetic proportions. Hence, a somewhat less compliant individual could also be somewhat more attractive, but this would not invalidate the crude aesthetic proportions.
A possible criticism of these proportions is that few people satisfy them. However, aesthetics is not about fairness, and in the light of the great diversity of physical appearance seen among humans, the very reason that makes it possible to specify some aesthetically pleasing proportions is that there is little diversity in the ranks of the highly aesthetically pleasing.
Some individuals have sought to explain beauty in terms of a recurring theme. A favorite theme has been the golden ratio, also referred to as the divine proportion (Fig 6a), which is found in several proportions seen in nature. A particularly tortuous attempt to describe facial aesthetics in terms of the golden ratio is the work of Stephen Marquardt (Figures 6b-d).
Fig 6a. The golden ratio, also known as the divine proportion. M/m = (M+m)/M ~ 1.618.
Fig 6b. The front view of the Marquardt Beauty Mask. Stephen Marquardt claims that attractive men and women from all ethnic groups fit this mask better than the less attractive, and the mask thus shows the outline of the ideal face. The mask is derived from a golden decagon, which in turn is derived from the golden ratio, a ratio found in many natural structures. The mask obviously describes the outline of a European.
Fig 6c. The side view of the Marquardt Beauty Mask. The mask is an outline of a European, and there is no clear justification by Marquardt as to why the outline of the European shown is the ideal face other than because this mask is derived from the golden decagon and it better fits attractive people. However, attempting to use a few angular structures to come up with ideal facial proportions is bound to better fit angular faces (more European) than non-angular faces (less European). In addition, the attractive people who best fit this mask are high-fashion models, which should not be surprising since Marquardt used them as a reference to come up with this mask. This should also explain why, contrary to Marquardt’s claim that the mask better fits women than men, the mask is not in the neighborhood of the outline of an average European woman. After all, high-fashion models are generally masculinized women.
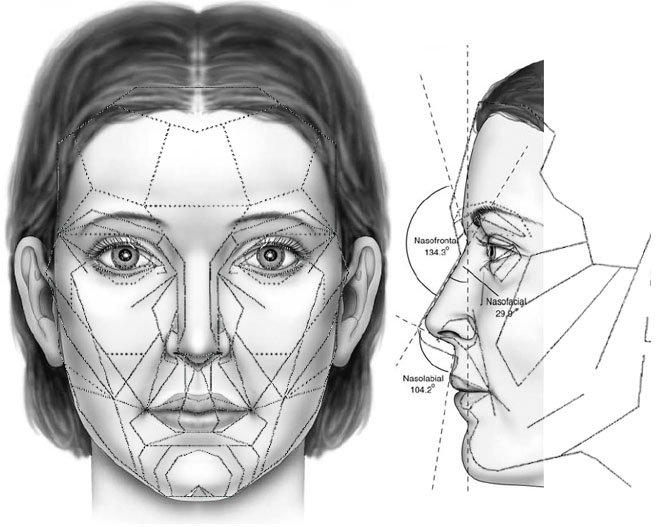
Fig 6d. The Marquardt Beauty Mask compared to the outline of the average North American white woman; outline of the average North American white woman taken from Farkas et al.(23, 24) Note that this method of shape comparison – the imperposition method recommended by Marquardt – is not the right way to compare face shapes, but is shown here as a rough comparison. Marquardt’s mask manifests the shape of a European woman that is robust in the cheekbones and very masculine (more projecting glabella, masculinized forehead profile, lowered eyebrows, stronger nasoglabellar curvature, more prominent nose, squared chin, narrowed mandibles in front view, regressed mandibular symphysis; see feminine vs. masculine page for details). Compared to Northern European norms, Marquardt’s mask also has a shorter lower-third of the face (subnasale-gnathion length), reduced nasospinale-prosthion length and a lowered nasion (see the locations of these landmarks on page 2), and these peculiarities in conjunction with the more prominent nose makes the mask shift away from the European (Northern European) and approach the Mediterranean/Mid-East on some counts (more prominent nose, shorter lower-third of the face) and non-European norms on other counts (lowered nasion, reduced nasospinale-prosthion length), which correspond to reduced attractiveness in a European context, especially in the male since men have longer chins than women. The outline of the average North American white female is obviously based on a sample biased toward gracile Northern Europeans in the sample of Farkas et al., and the attractive North American white female would be a somewhat more feminized version of this outline, but Marquardt’s mask would be an even worse fit for the attractive North American white female. Obviously, the Marquardt beauty mask has no validity and does not describe an ideal face in a European context, let alone in a non-European context, notwithstanding some attractive individuals better fitting this mask than less attractive individuals and/or individuals with gross facial abnormalities. As discussed previously, crude indices cannot capture the subtlety of aesthetics, and for all the seeming complexity of the mask and its tortuous derivation, the mask remains a crude index of facial proportions.
The possibility of describing aesthetically pleasing facial proportions in terms of the golden ratio should be evaluated in light of how attractiveness relates to deviation from proportions based on the golden ratio. In the case of the Marquardt Beauty Mask, it is clear that the average North American white woman would look worse if she were more compliant with the mask. Read the formal refutation of the Stephen Marquardt Phi (Golden Ratio) mask/archetype.
In another example, a study evaluated a series of facial measurements in lateral view (Fig 7) in a sample of Germans who were rated for attractiveness in front view.(25) The sample comprised of 30 attractive (25 female, 5 male; aged 14-22 years) participants and 32 nonattractive (11 female and 21 male; aged 14-24 years) participants.
Fig 7. Landmarks and variables assessed in cephalometric radiographs.(25)
Table 4a shows that only a few of the lateral measurements were related to attractiveness in front view, and these measures involved the extent of jaw/lip projection relative to the rest of the face, a somewhat more protrusive jaw/lip being related to greater attractiveness in women and a somewhat more regressed jaw/lip related to greater attractiveness in men, and these correlates are in the direction of face shape change related to increased feminization and increased masculinization, respectively.
| Table 4a. Difference (D) in cephalometric radiographic variables, when comparing 21 attractive (A) females (f) with 11 non-attractive (NA) females (f) and 11 non-attractive (NA) females (f) with 21 non-attractive (NA) males (m).(25) |
 |
The authors assessed five transverse and seven vertical facial distances from the front view of each participant’s photograph and calculated two facial disproportion indices in the transverse and vertical planes by comparing the transverse and vertical facial distances to the corresponding distances based on the golden ratio, and then computed the correlations between the lateral measurements and the facial disproportion indices (Table 4b). Most of the correlations were insignificant. The only significant correlations were for nonattractive women, and for the posterior facial height index (Spp-Go′/S-Go′ × 100) and the transverse facial disproportion index (r = 0.80, P = .00), and the ML/NL angle and the transverse (r = −0.73, P = .01) and vertical (r = 0.68, P > .01) facial disproportion indices.
| Table 4b. Correlation (r) between cephalometric radiographic variables and the transverse and vertical facial disproportion indices. Analysis of 21 attractive (A) and 11 non-attractive (NA) females (f) and 21 non-attractive (NA) males (m).(25) |
 |
Thus, crude assessments, including those based on the golden ratio or divine proportion, hardly describe facially beauty well. Read more about the golden ratio and its relation to beauty.
Comment
Whereas a number of objective correlates of beauty that apply within populations have been documented, it is not possible to come up with objective criteria that are sufficiently exacting for the purposes of comparing the attractiveness of women from different geographic populations in beauty pageants. Two possible objections to this conclusion are that I have deliberately not addressed correlates of beauty that apply both within and between populations or that given the abstract nature of some correlates of beauty, it is possible that some correlates of beauty that apply both within and between populations have not yet been discovered. However, it is clear that there are multiple correlates of beauty, and if it can be shown that several of the major ones apply within populations but not between populations, then notwithstanding correlates of beauty in accordance with the objections, the aforementioned conclusion holds.
References
- Martinez-Abadias, N., Gonzalez-Jose, R., Gonzalez-Martin, A., Van der Molen, S., Talavera, A., Hernandez, P., and Hernandez, M., Phenotypic evolution of human craniofacial morphology after admixture: a geometric morphometrics approach, Am J Phys Anthropol, 129, 387 (2006).
- Rosenberg, N. A., Mahajan, S., Ramachandran, S., Zhao, C., Pritchard, J. K., and Feldman, M. W., Clines, Clusters, and the Effect of Study Design on the Inference of Human Population Structure, PLoS Genet, 1, e70 (2005).
- Brace, C. L., and Hunt, K. D., A non-racial craniofacial perspective on human variation: A(ustralia) to Z(uni), Am J Phys Anthropol, 82, 341 (1990).
- Gould, S. J., Ontogeny and phylogeny, Harvard University Press, Cambridge, MA (1977).
- Penin, X., Berge, C., and Baylac, M., Ontogenetic study of the skull in modern humans and the common chimpanzees: neotenic hypothesis reconsidered with a tridimensional Procrustes analysis, Am J Phys Anthropol, 118, 50 (2002).
- Papers by Groves, C. P. and Habgood, P. J. in The human revolution: behavioural and biological perspectives in the origins of modern humans, Mellars, P., and Stringer, C., Eds., Edinburgh University Press, Edinburgh, pp. 245-285 (1989).
- Stringer, C. B., Replacement, continuity and the origin of Homo sapiens, in Continuity or replacement: controversies in Homo sapiens evolution, Brauer, G., and Smith, F. H., Eds., A.A. Balkema, Rotterdam, pp. 9 (1992); also see pages 273-288 for a paper by Habgood, P. J. on the origin of anatomically modern humans in East Asia.
- Lahr, M. M., The evolution of modern human diversity: a study of cranial variation, Cambridge University Press, Cambridge, U.K. (1996).
- Choe, K. S., Sclafani, A. P., Litner, J. A., Yu, G. P., and Romo, T., 3rd, The Korean American woman's face: anthropometric measurements and quantitative analysis of facial aesthetics, Arch Facial Plast Surg, 6, 244 (2004).
- Jantz, R. L., and Meadows Jantz, L., Secular change in craniofacial morphology, Am J Human Biol, 12, 327 (2000).
- Little, B. B., Buschang, P. H., Pena Reyes, M. E., Tan, S. K., and Malina, R. M., Craniofacial dimensions in children in rural Oaxaca, Southern Mexico: Secular change, 1968-2000, Am J Phys Anthropol, Epub ahead of print (2006).
- Ross, C. F., In vivo function of the craniofacial haft: the interorbital "pillar", Am J Phys Anthropol, 116, 108 (2001).
- Brace, C. L., Rosenberg, K. R., and Hunt, K. D., What big teeth you had grandma! Human tooth size, past and present, in Advances in dental anthropology, Kelly, M. A., and Larsen, C. S., Eds., Wiley-Liss, New York, pp. 33 (1991).
- Hanihara, T., and Ishida, H., Metric dental variation of major human populations, Am J Phys Anthropol, 128, 287 (2005).
- Makova, K., and Norton, H., Worldwide polymorphism at the MC1R locus and normal pigmentation variation in humans, Peptides, 26, 1901 (2005).
- Frost, P., European hair and eye color: A case of frequency-dependent sexual selection?, Evol Hum Behav, 27, 85 (2006).
- Holland, E., The nature of homosexuality: vindication for the religious right and homosexual activists, iUNiverse, Lincoln, NE (2004).
- Liu, Y., Schlumberger, A., Wirth, K., Schmidtbleicher, D., and Steinacker, J. M., Different effects on human skeletal myosin heavy chain isoform expression: strength vs. combination training, J Appl Physiol, 94, 2282 (2003).
- Staron, R. S., Karapondo, D. L., Kraemer, W. J., Fry, A. C., Gordon, S. E., Falkel, J. E., Hagerman, F. C., and Hikida, R. S., Skeletal muscle adaptations during early phase of heavy-resistance training in men and women, J Appl Physiol, 76, 1247 (1994).
- Short, K. R., Vittone, J. L., Bigelow, M. L., Proctor, D. N., Coenen-Schimke, J. M., Rys, P., and Nair, K. S., Changes in myosin heavy chain mRNA and protein expression in human skeletal muscle with age and endurance exercise training, J Appl Physiol, 99, 95 (2005).
- O'Neill, D. S., Zheng, D., Anderson, W. K., Dohm, G. L., and Houmard, J. A., Effect of endurance exercise on myosin heavy chain gene regulation in human skeletal muscle, Am J Physiol, 276, R414 (1999).
- Fruscella, P., Morphodynamics and surgical correction of the body's creases, folds, and wrinkles, Aesthetic Plast Surg, 28, 37 (2004).
- Farkas, L. G., Hreczko, T. A., Kolar, J. C., and Munro, I. R., Vertical and horizontal proportions of the face in young adult North American Caucasians: revision of neoclassical canons, Plast Reconstr Surg, 75, 328 (1985).
- Farkas, L. G., Kolar, J. C., and Munro, I. R., Geography of the nose: a morphometric study, Aesthetic Plast Surg, 10, 191 (1986).
- Matoula, S., and Pancherz, H., Skeletofacial morphology of attractive and nonattractive faces, Angle Orthod, 76, 204 (2006).